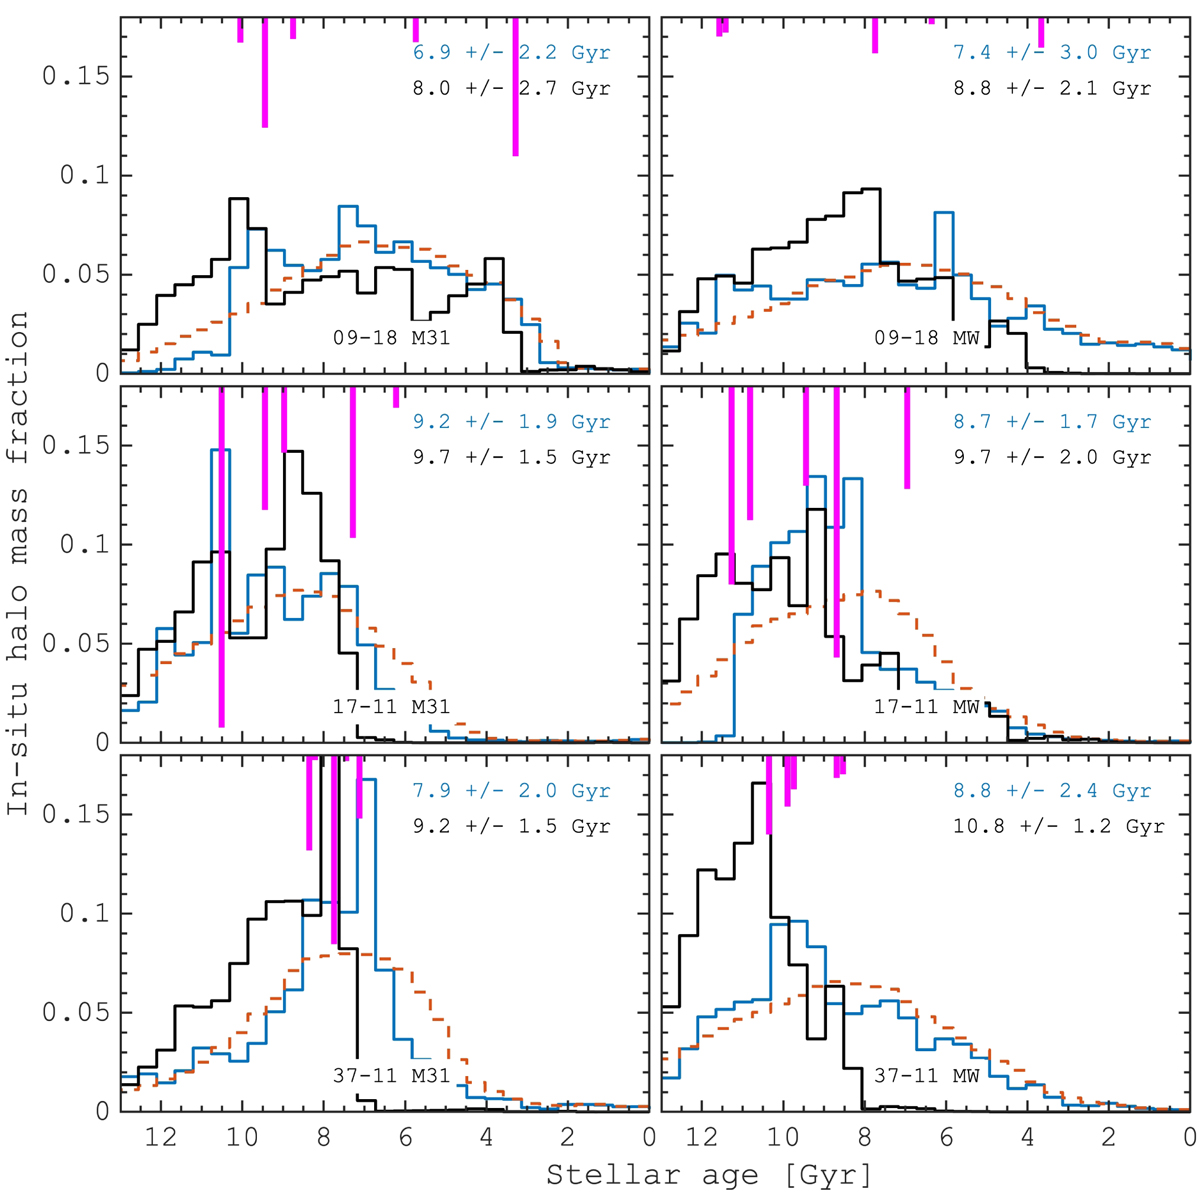
Fig. 11.
Download original image
Age distribution of the kinematically defined stellar haloes (blue lines; see, Toomre diagram in Fig. 9 for the definition). The red dashed lines correspond to the distributions with the constant 20% age uncertainty. Black lines show the age distribution of the accreted component of the stellar halo. The numbers in the top left corner of each panel show the mean and the standard deviation of the stellar ages for the in situ (blue) and accreted (black) halo. The vertical magenta lines highlight five of the most significant mergers (M1–M5), in terms of the stellar mass ratio. The age distributions show a larger fraction of stars that formed inside the main progenitors close to the times of the mergers. However, the features completely vanished once the age errors were taken into account. Such a distribution transformation is not the result of the error itself but also because a substantial fraction of stars populating the kinematically defined halo between the merger events.
Current usage metrics show cumulative count of Article Views (full-text article views including HTML views, PDF and ePub downloads, according to the available data) and Abstracts Views on Vision4Press platform.
Data correspond to usage on the plateform after 2015. The current usage metrics is available 48-96 hours after online publication and is updated daily on week days.
Initial download of the metrics may take a while.