Open Access
Fig. 2.
Download original image
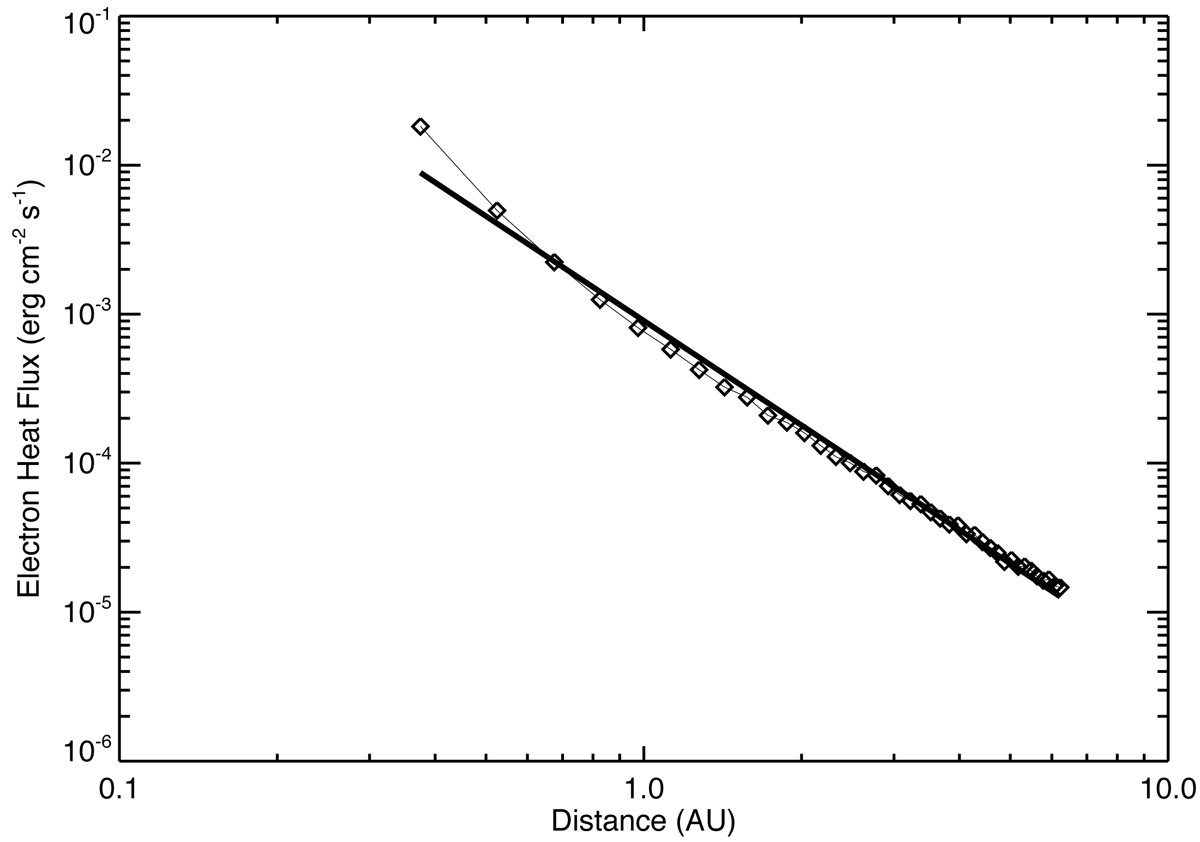
Simulated electron heat flux from 0.375 AU to 6.075 AU (Landi et al. 2012), shown as the line joining the diamonds. Solid line represents a linear regression through the simulated data.
Current usage metrics show cumulative count of Article Views (full-text article views including HTML views, PDF and ePub downloads, according to the available data) and Abstracts Views on Vision4Press platform.
Data correspond to usage on the plateform after 2015. The current usage metrics is available 48-96 hours after online publication and is updated daily on week days.
Initial download of the metrics may take a while.