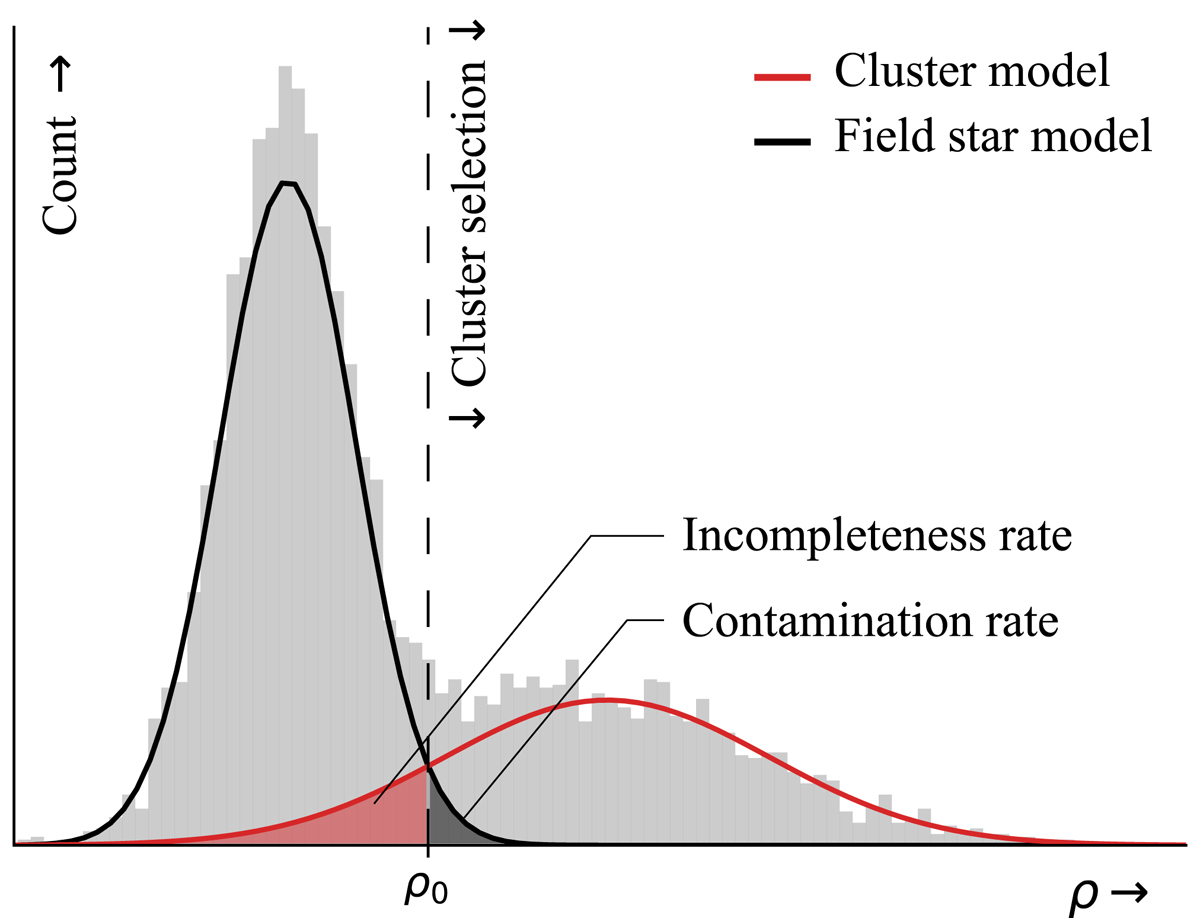
Fig. 6.
Download original image
Noise reduction schematic. We fit the observed uni-variate density distribution, ρ, with a mixture of two Gaussians that model the cluster (red line) and field star (black line) population, respectively. We obtained an approximation to the field star contamination and incompleteness rate in the cluster sample by considering the cluster-noise classifier’s confusion matrix entries, particularly false positives, false negatives, and true positives.
Current usage metrics show cumulative count of Article Views (full-text article views including HTML views, PDF and ePub downloads, according to the available data) and Abstracts Views on Vision4Press platform.
Data correspond to usage on the plateform after 2015. The current usage metrics is available 48-96 hours after online publication and is updated daily on week days.
Initial download of the metrics may take a while.