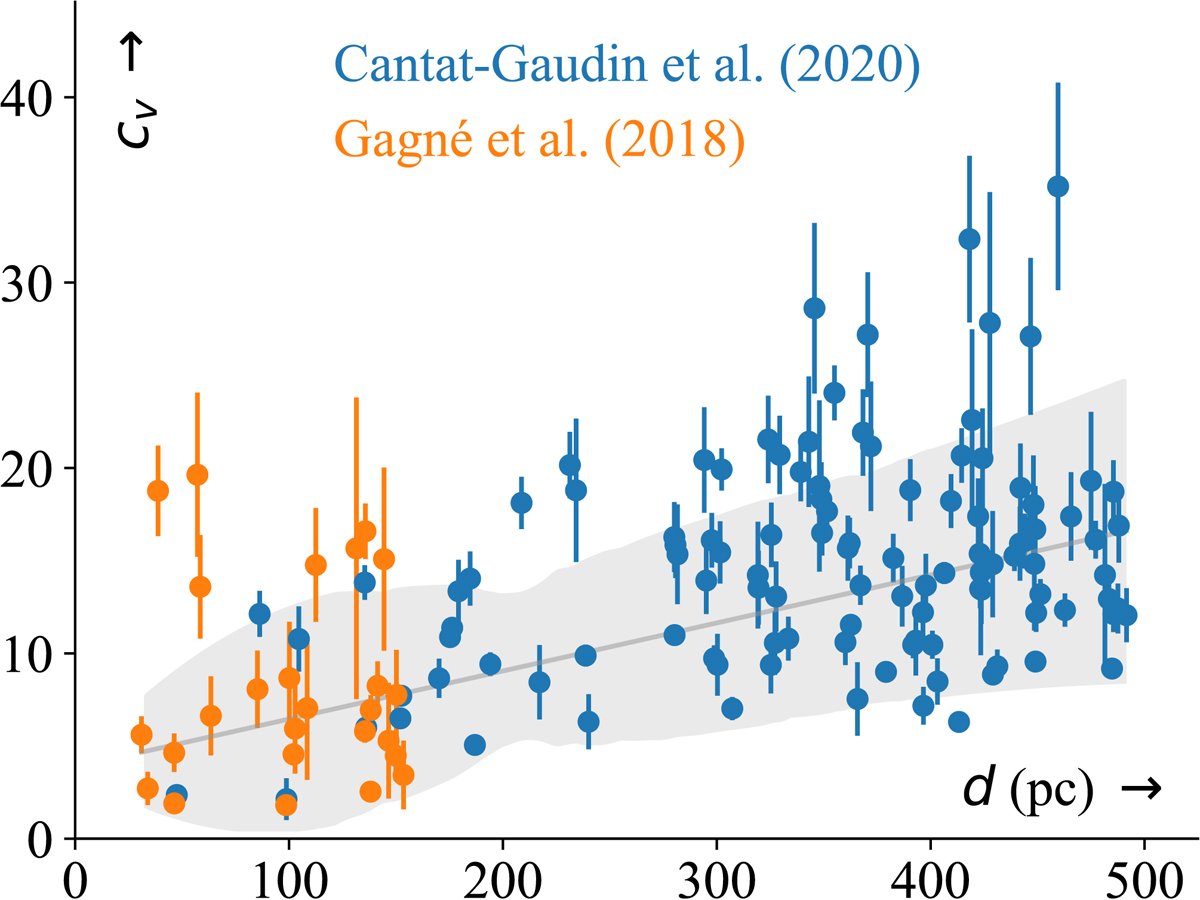
Fig. 4.
Download original image
Empirical distance-scaling relationship using data from Gagné et al. (2018b) and Cantat-Gaudin & Anders (2020). The x-axis represents the distance to stellar clusters; the y-axis shows the dispersion ratio of positional over kinematic subspaces. This dispersion directly corresponds to the velocity scaling factor, cv, as discussed in Sect. 3.3.3. The gray line represents the best fit linear regression line, while the gray band indicates the 1σ highest density interval obtained from sampling the posterior predictive distribution.
Current usage metrics show cumulative count of Article Views (full-text article views including HTML views, PDF and ePub downloads, according to the available data) and Abstracts Views on Vision4Press platform.
Data correspond to usage on the plateform after 2015. The current usage metrics is available 48-96 hours after online publication and is updated daily on week days.
Initial download of the metrics may take a while.