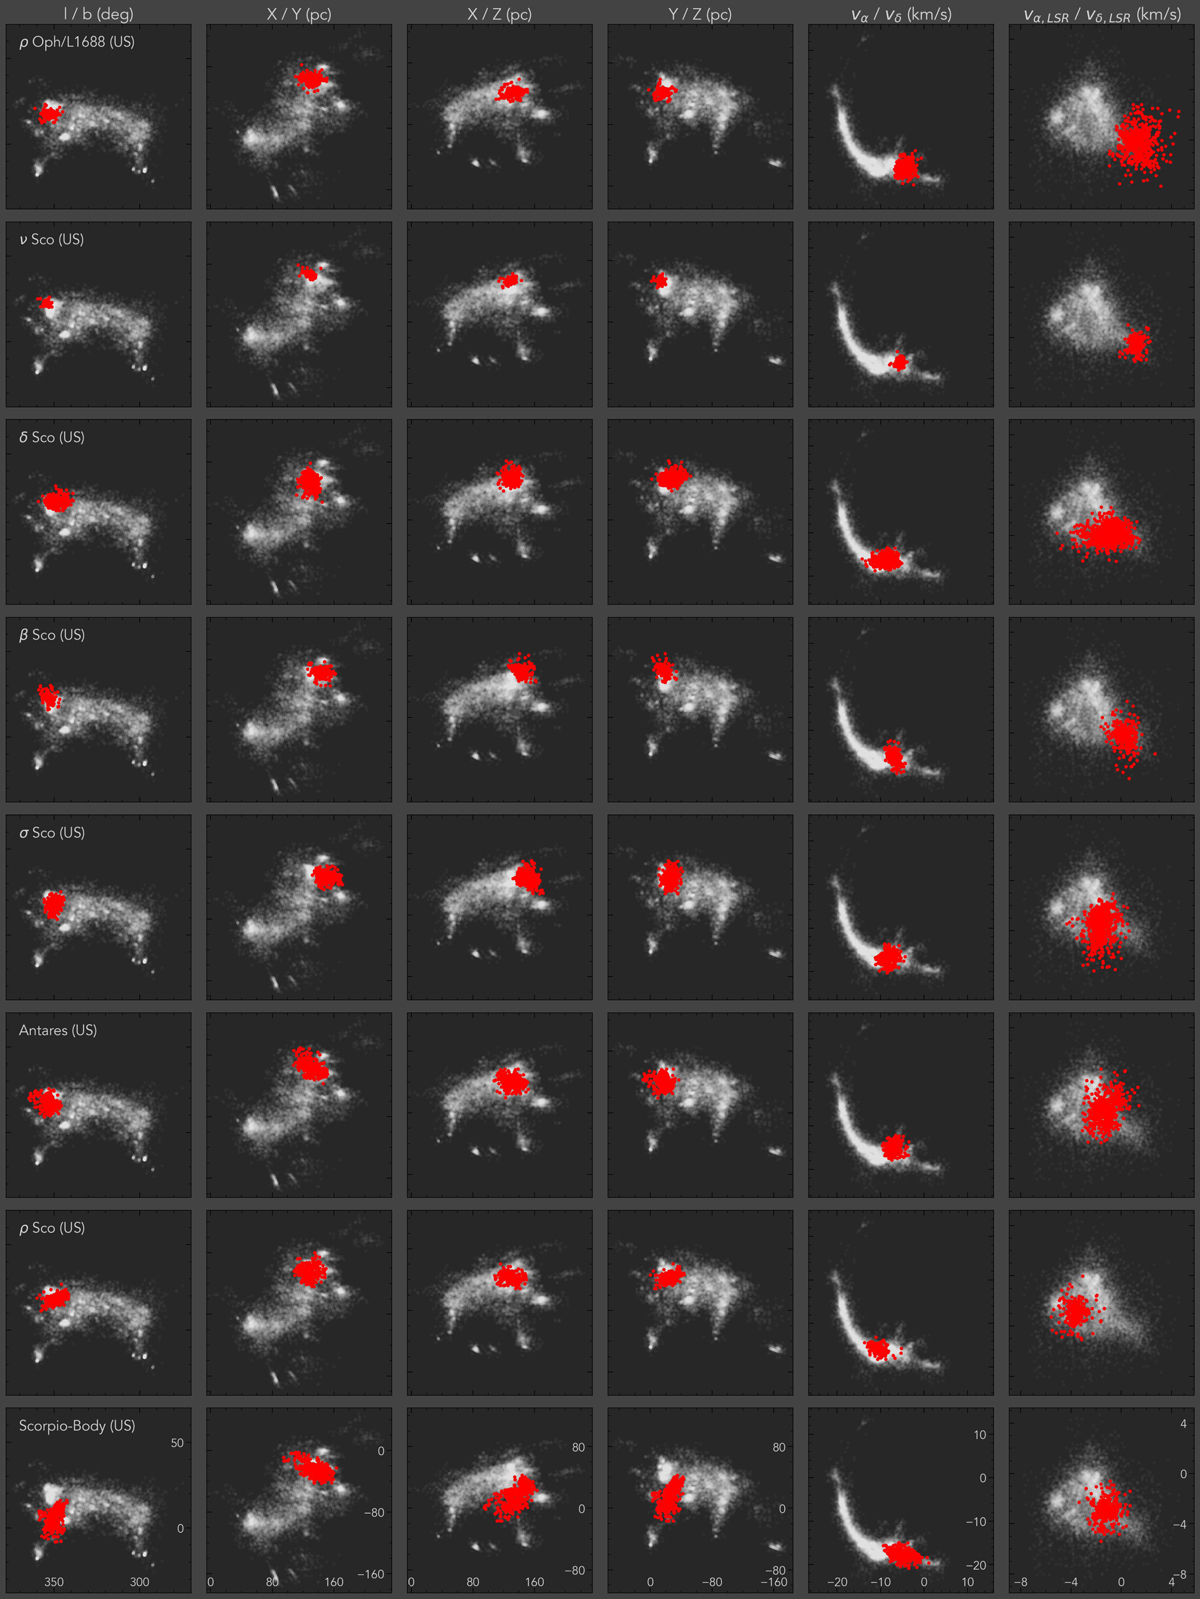
Fig. E.1.
Download original image
Six parameter spaces, with the individual clusters highlighted in red. Shown are clusters SigMA 1–8 (part of US). The gray background sources are all SigMA-selected Sco-Cen members. Cluster names are given in the left panels of each row. The used xy-axes are given as titles at the top of each column. Tick labels are only given in the bottom row. Note that the vLSR space shows a smaller velocity range compared to the tangential velocity space in Col. 5 and hence a lower velocity dispersion. See also Figs. 10–13 and the main text for more details.
Current usage metrics show cumulative count of Article Views (full-text article views including HTML views, PDF and ePub downloads, according to the available data) and Abstracts Views on Vision4Press platform.
Data correspond to usage on the plateform after 2015. The current usage metrics is available 48-96 hours after online publication and is updated daily on week days.
Initial download of the metrics may take a while.