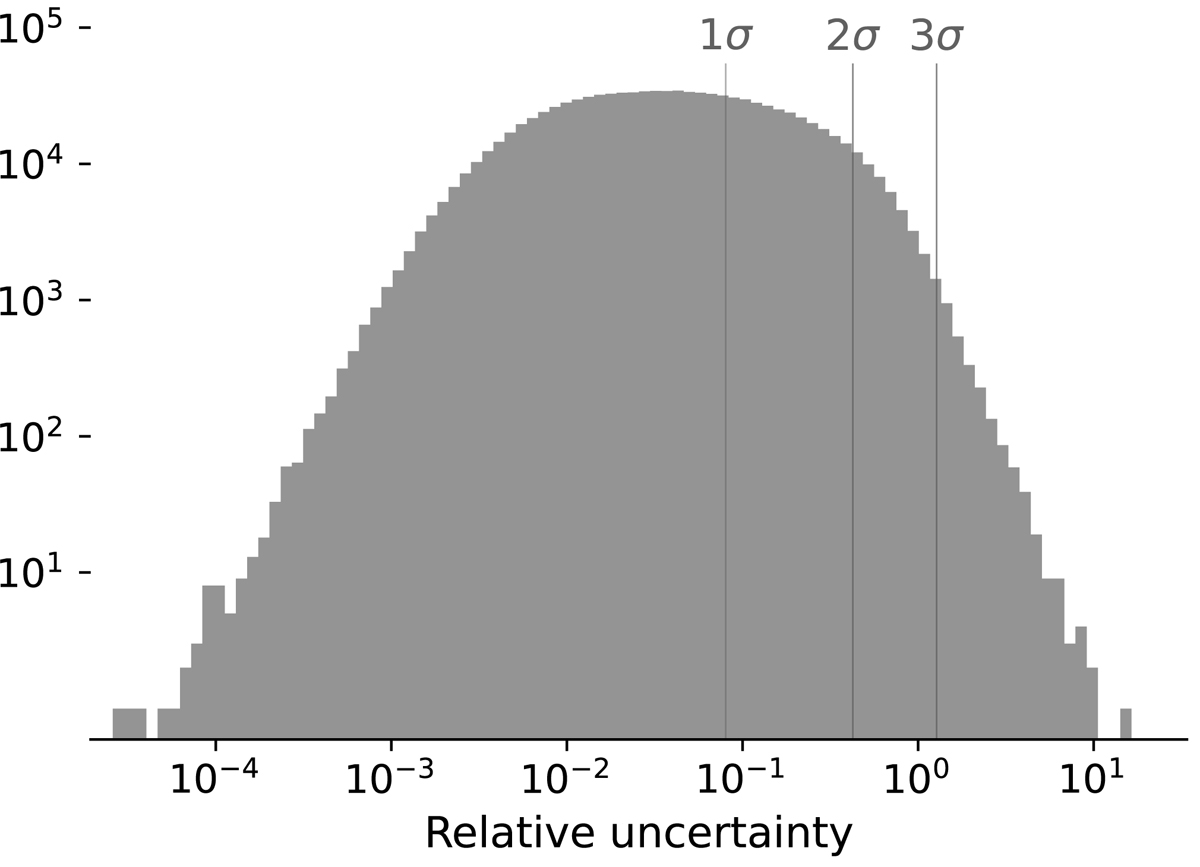
Fig. B.7.
Download original image
Log-log histogram showing the relative uncertainty of data points, i.e., the ratio of positional uncertainty given by the error covariance matrix over the nearest neighbor distance. The majority of data points are far below unity. The concentration of relative uncertainty values at zero indicates that k-distances across resampled data sets are strongly correlated. The 1σ, 2σ, and 3σ lines indicate the percentiles containing 68, 95, and 99.7% of the respective distribution.
Current usage metrics show cumulative count of Article Views (full-text article views including HTML views, PDF and ePub downloads, according to the available data) and Abstracts Views on Vision4Press platform.
Data correspond to usage on the plateform after 2015. The current usage metrics is available 48-96 hours after online publication and is updated daily on week days.
Initial download of the metrics may take a while.