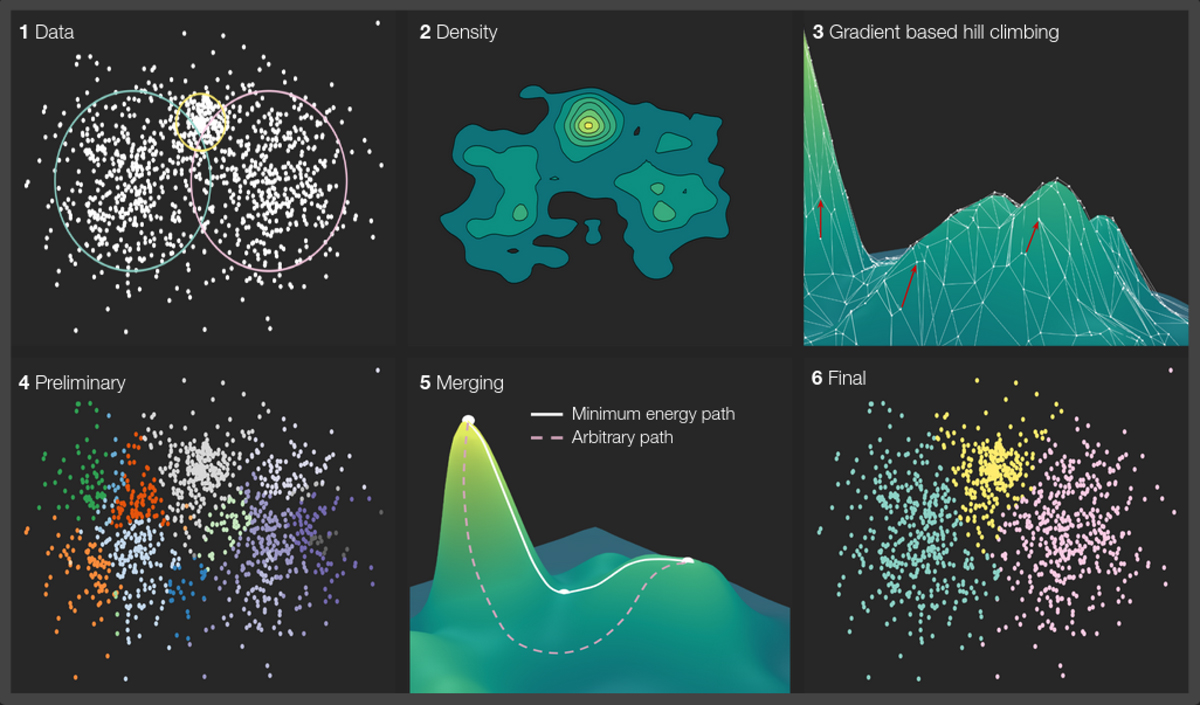
Fig. 2.
Download original image
Proposed clustering process SigMA, highlighted on a 2D toy data set of three Gaussians with variable covariance matrices and means. (1) The generated toy data set consisting of three bivariate Gaussians shown in white alongside 2σ confidence ellipses in color. (2) The clustering procedure starts off by estimating the density of the input data. (3) Next, a graph-based hill climbing step is performed in which points are propagated along gradient lines toward local peaks. (4) This gradient propagation results in a preliminary segmentation of input samples that typically is far too fine-grained. (5) These segmented regions are iteratively merged with a parent mode if a modality test along the MEP detects no significant density dip. (6) The final segmentation retains all three clusters.
Current usage metrics show cumulative count of Article Views (full-text article views including HTML views, PDF and ePub downloads, according to the available data) and Abstracts Views on Vision4Press platform.
Data correspond to usage on the plateform after 2015. The current usage metrics is available 48-96 hours after online publication and is updated daily on week days.
Initial download of the metrics may take a while.