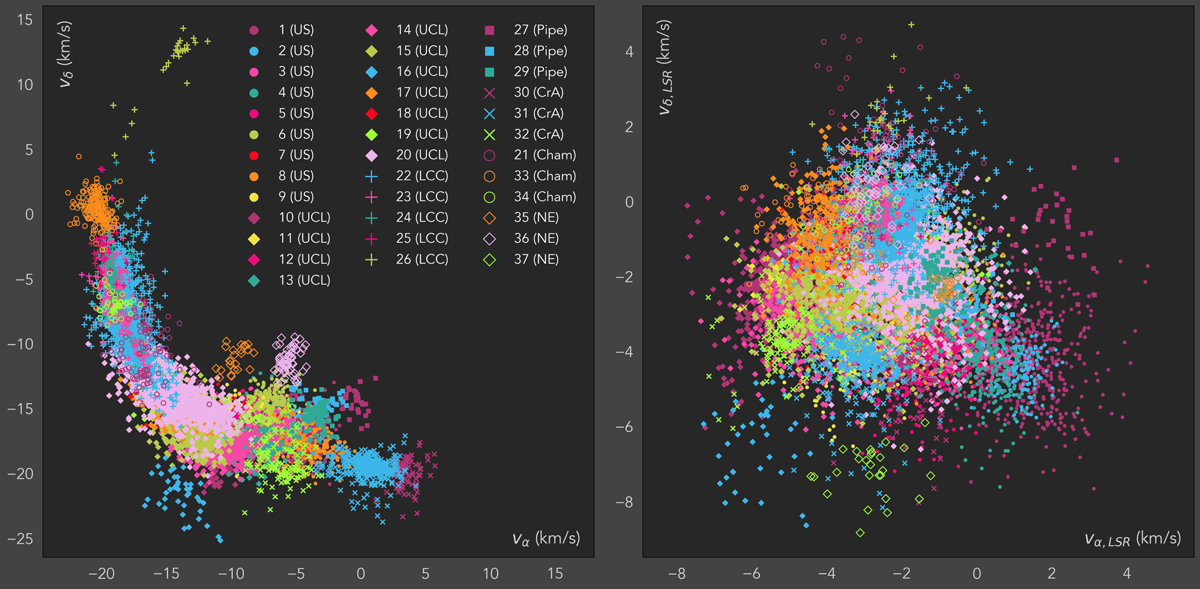
Fig. 13.
Download original image
Tangential velocity distribution of the 37 SigMA clusters. Colors and labels are as in Fig. 10. Left: Observed tangential velocities along α and δ are strongly influenced by the Sun’s reflex motion, while stellar clusters at similar distances and with similar space motions are arranged in a loop-like pattern. Sources at l ∼ 0° are located in the lower-right part of the figure, and sources at l ∼ 290° in the upper-left part of the figure (see Fig. C.1). Right: Tangential velocities corrected for the Sun’s motion, and hence relative to the LSR. The correction reduces the projection effects of the observed tangential stellar motions. See the interactive 2D version online and Figs. E.1–E.5 for a better appreciation of the 2D kinematical properties of the clusters in Sco-Cen.
Current usage metrics show cumulative count of Article Views (full-text article views including HTML views, PDF and ePub downloads, according to the available data) and Abstracts Views on Vision4Press platform.
Data correspond to usage on the plateform after 2015. The current usage metrics is available 48-96 hours after online publication and is updated daily on week days.
Initial download of the metrics may take a while.