Fig. 10.
Download original image
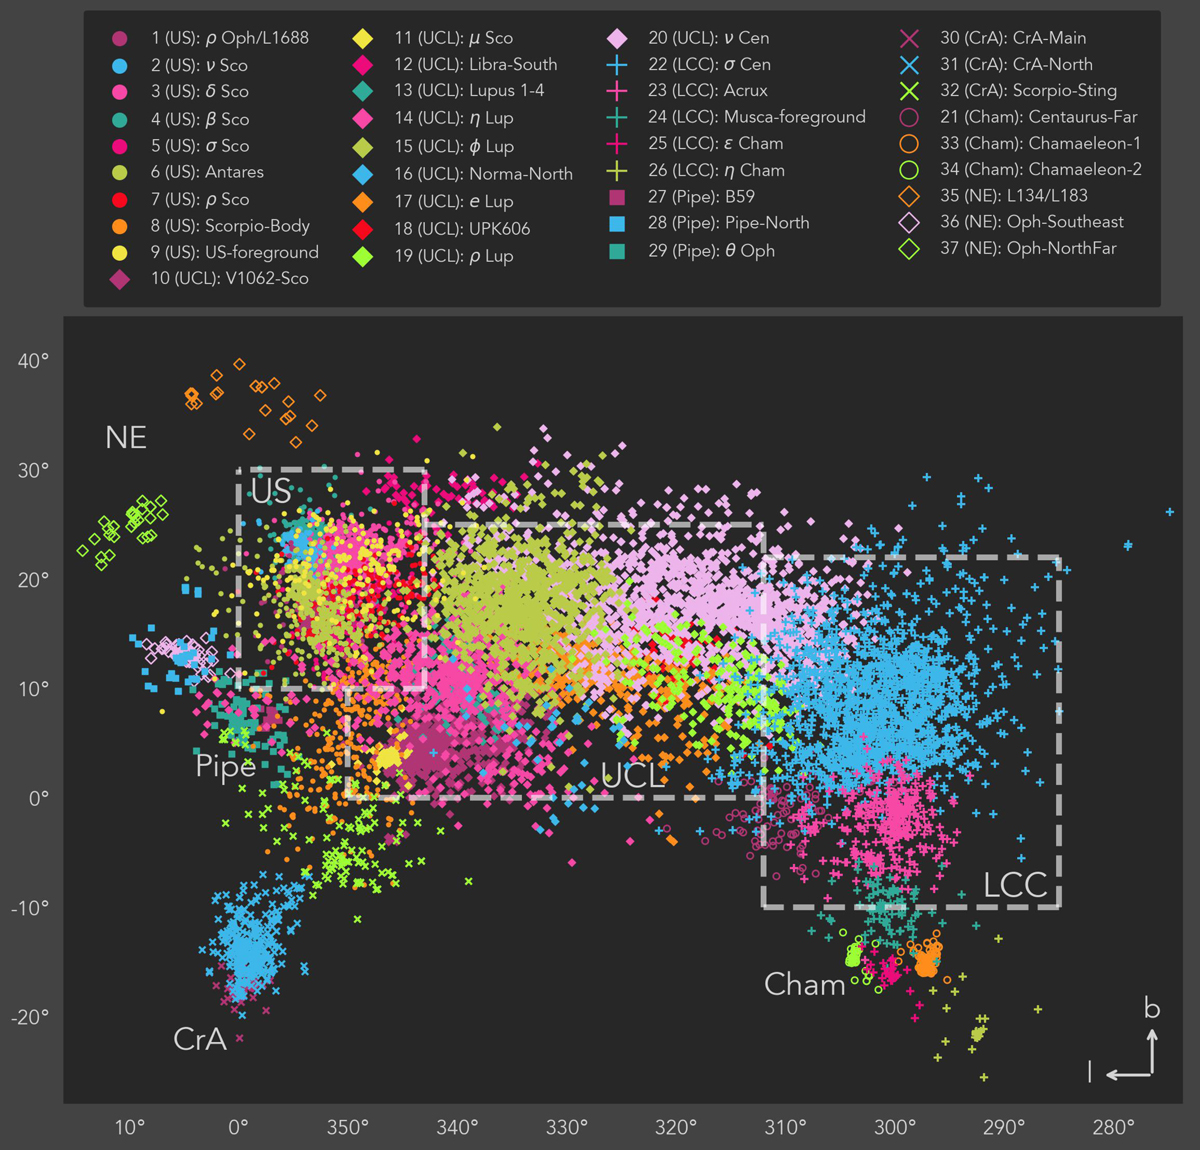
Distribution of the 37 SigMA clusters in Sco-Cen, projected in Galactic coordinates. Traditionally, the Sco-Cen OB association is separated into US, UCL, and LCC, marked with gray dashed lines. The clusters extracted with SigMA reveal a more complex substructure of Sco-Cen than initially proposed by Blaauw (1946), and they show a more extended spatial distribution that includes the CrA, Pipe, and Cham regions and additional stellar clusters toward the northeast (NE). The clusters are ordered in the legend by region, as given in Table 3. See the interactive 2D version online or Fig. 11 for a separate view of each cluster. For a better visualization of the clusters’ distribution, see the interactive 3D version online (Fig. 12).
Current usage metrics show cumulative count of Article Views (full-text article views including HTML views, PDF and ePub downloads, according to the available data) and Abstracts Views on Vision4Press platform.
Data correspond to usage on the plateform after 2015. The current usage metrics is available 48-96 hours after online publication and is updated daily on week days.
Initial download of the metrics may take a while.