Fig. 9
Download original image
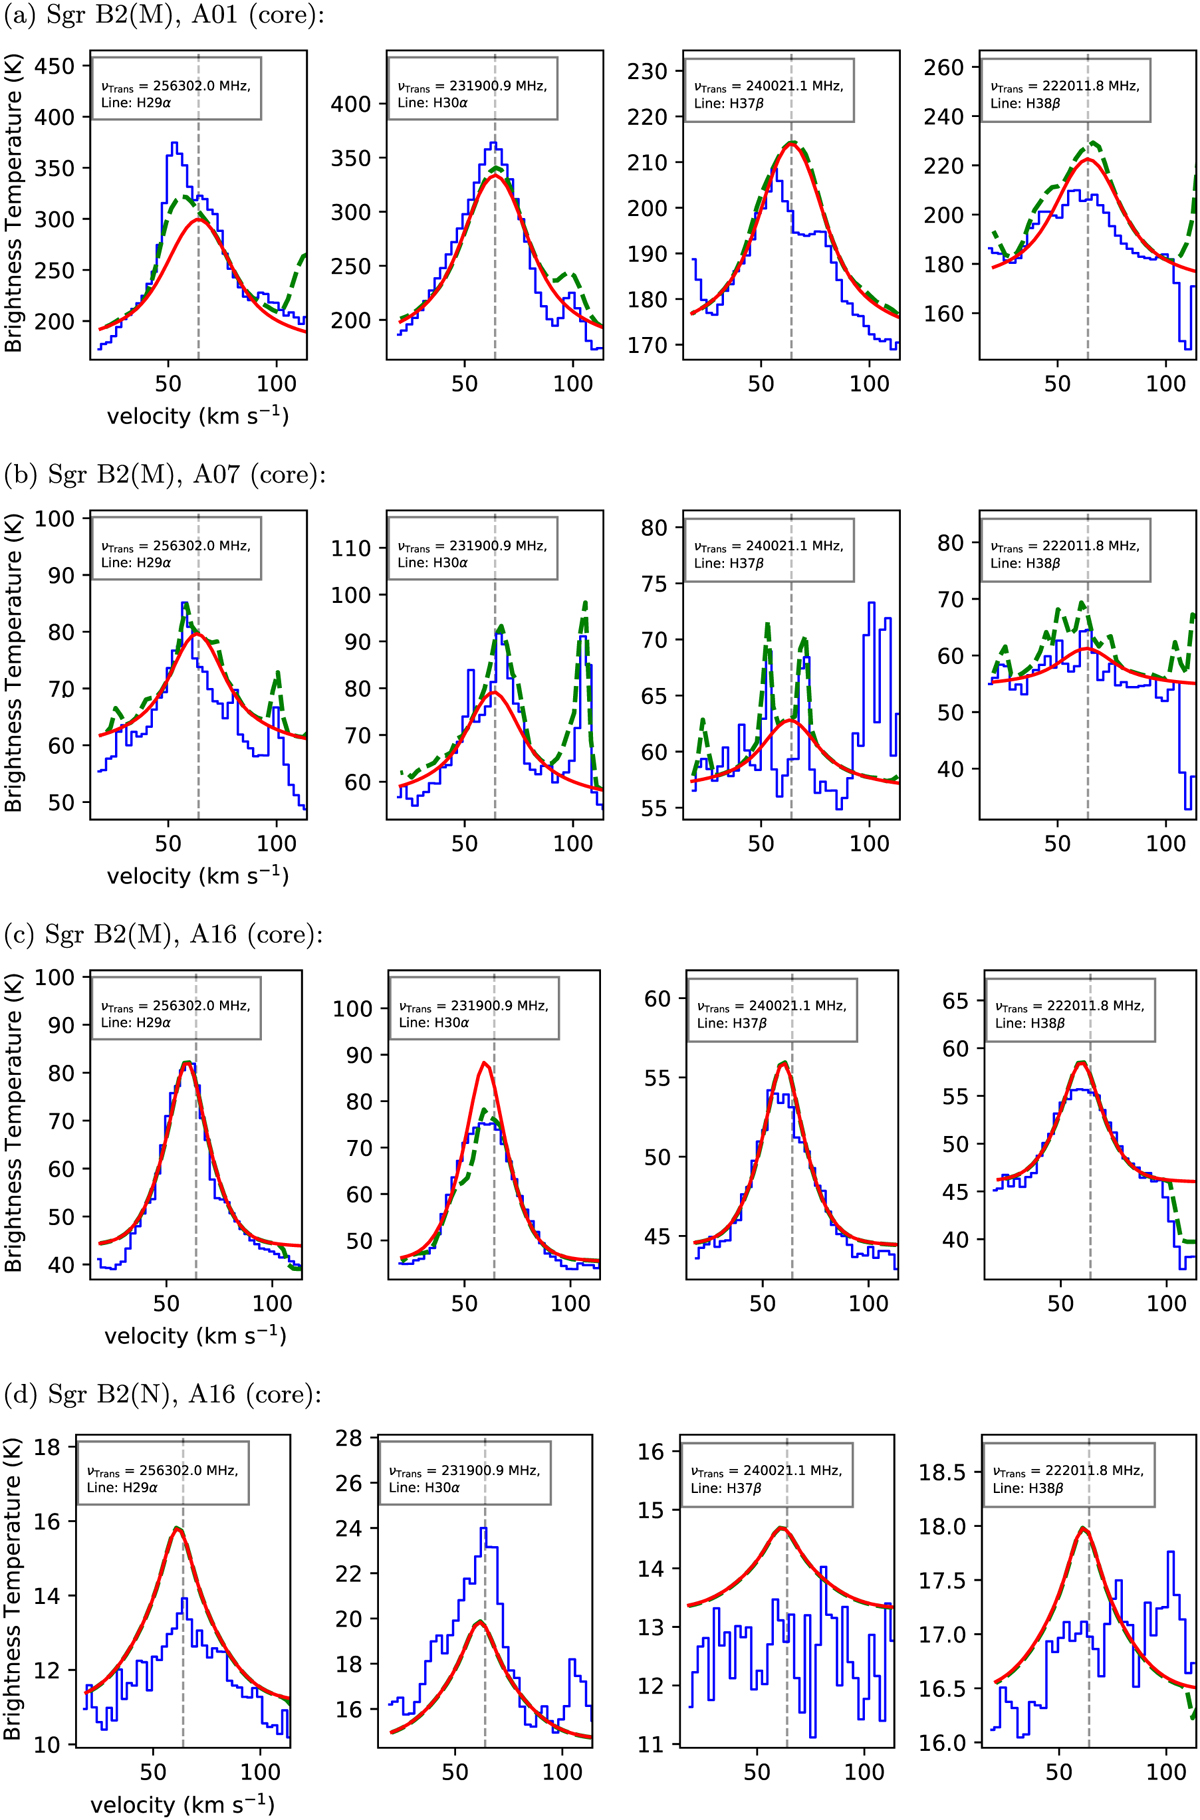
Selected RRLs in core spectra of A01 (a), A07 (b), and A16 (c) in Sgr B2(M) and A16 (d) in Sgr B2(N). The observational data is described by the blue line, the pure RRL contribution by the red line, and the model spectrum taking all identified molecules into account by the dashed green line. The vertical gray dashed line indicates the source velocity of Sgr B2(M).
Current usage metrics show cumulative count of Article Views (full-text article views including HTML views, PDF and ePub downloads, according to the available data) and Abstracts Views on Vision4Press platform.
Data correspond to usage on the plateform after 2015. The current usage metrics is available 48-96 hours after online publication and is updated daily on week days.
Initial download of the metrics may take a while.