Open Access
Fig. 6
Download original image
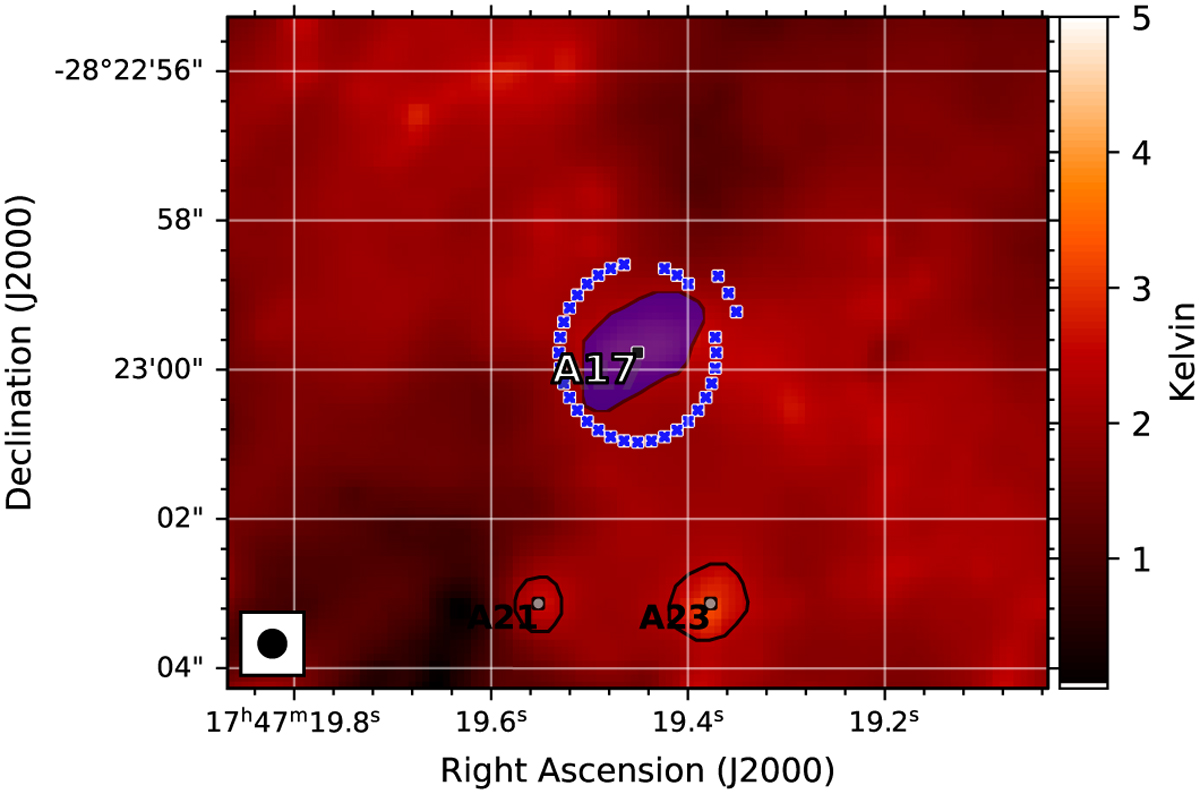
Continuum emission toward Sgr B2(M) at 242 GHz around core A17 (blue shaded polygon). The positions used for the computation of the averaged envelope spectrum are indicated by blue crosses. The neighboring cores are indicated by blackcontours. The synthesized beam of 0.″4 is shown in the lower left corner.
Current usage metrics show cumulative count of Article Views (full-text article views including HTML views, PDF and ePub downloads, according to the available data) and Abstracts Views on Vision4Press platform.
Data correspond to usage on the plateform after 2015. The current usage metrics is available 48-96 hours after online publication and is updated daily on week days.
Initial download of the metrics may take a while.