Fig. 4
Download original image
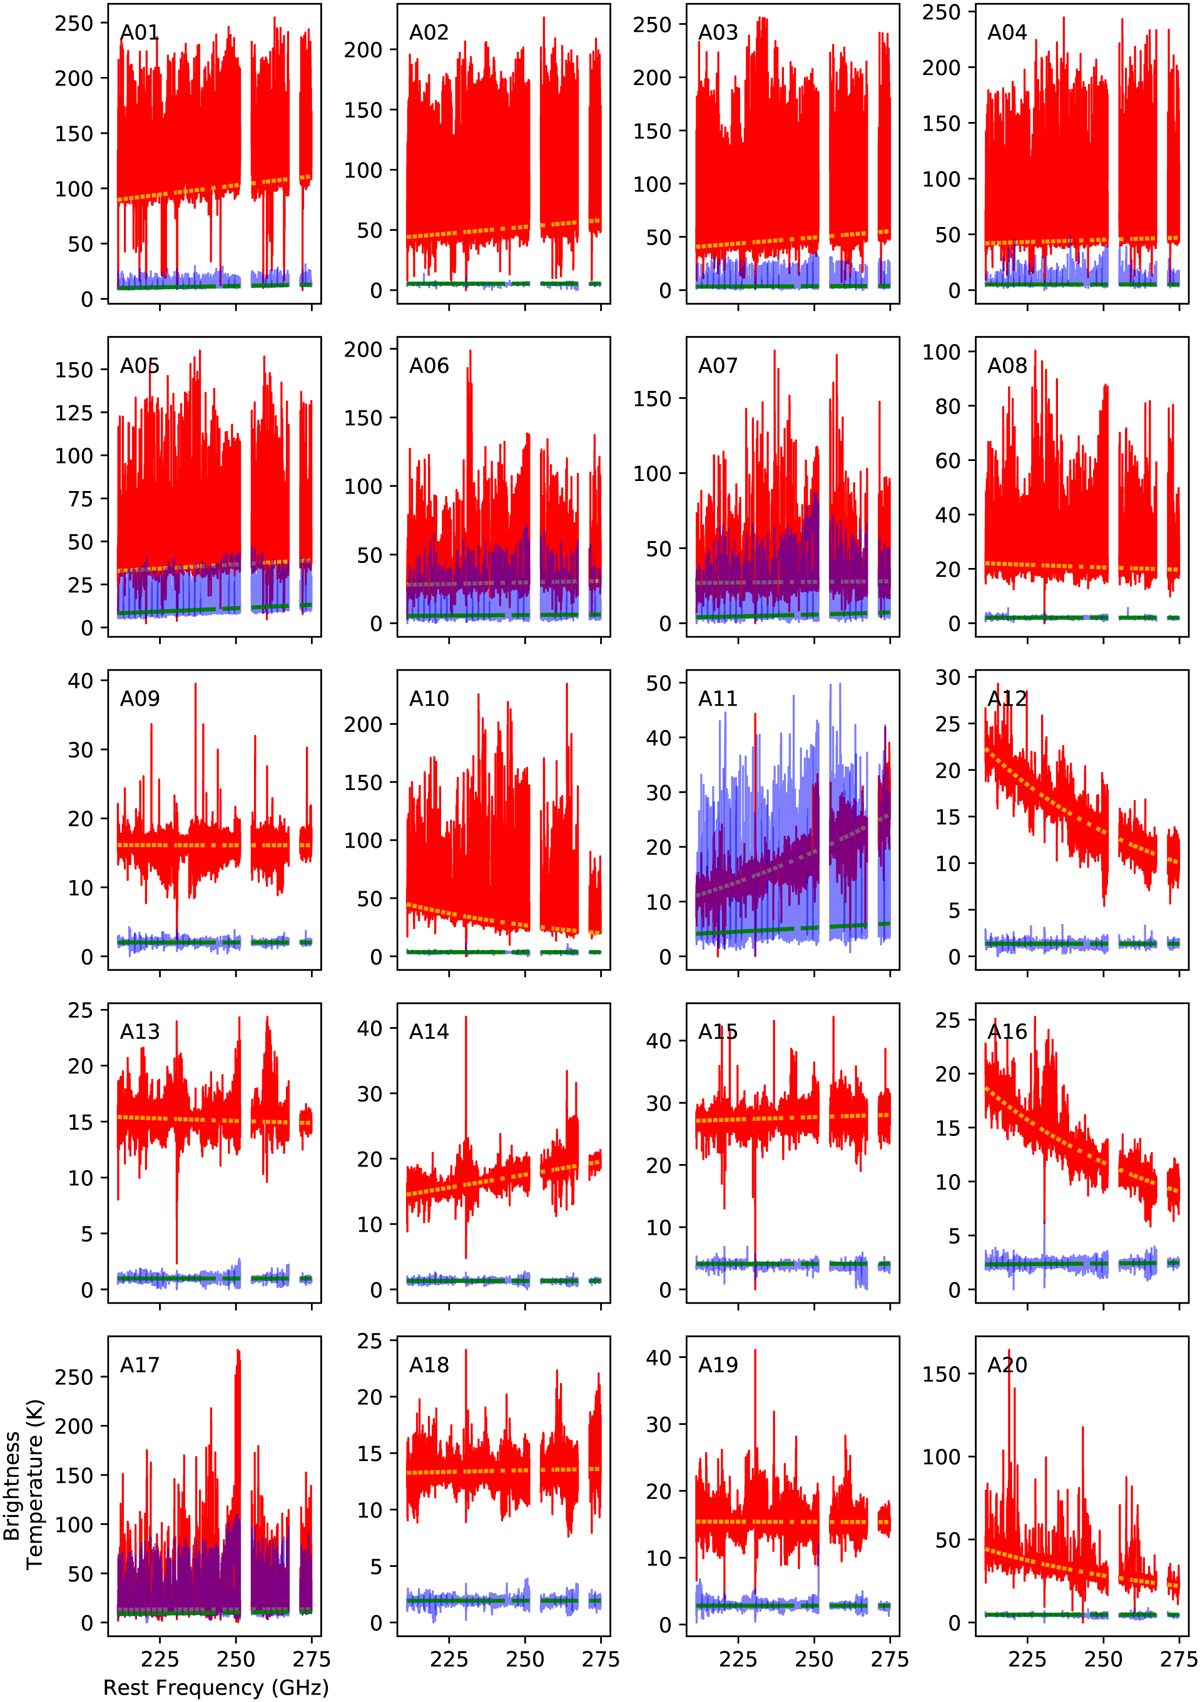
Core (red line) and envelope (blue line) spectra for each core toward Sgr B2(N). The procedure used to calculate the envelope spectra is described in Sect. 3.5.2. The continuum level for each core spectrum is indicated by the orange dotted line, while the continuum level of each envelope spectrum is indicated by the green dotted line.
Current usage metrics show cumulative count of Article Views (full-text article views including HTML views, PDF and ePub downloads, according to the available data) and Abstracts Views on Vision4Press platform.
Data correspond to usage on the plateform after 2015. The current usage metrics is available 48-96 hours after online publication and is updated daily on week days.
Initial download of the metrics may take a while.