Fig. 10
Download original image
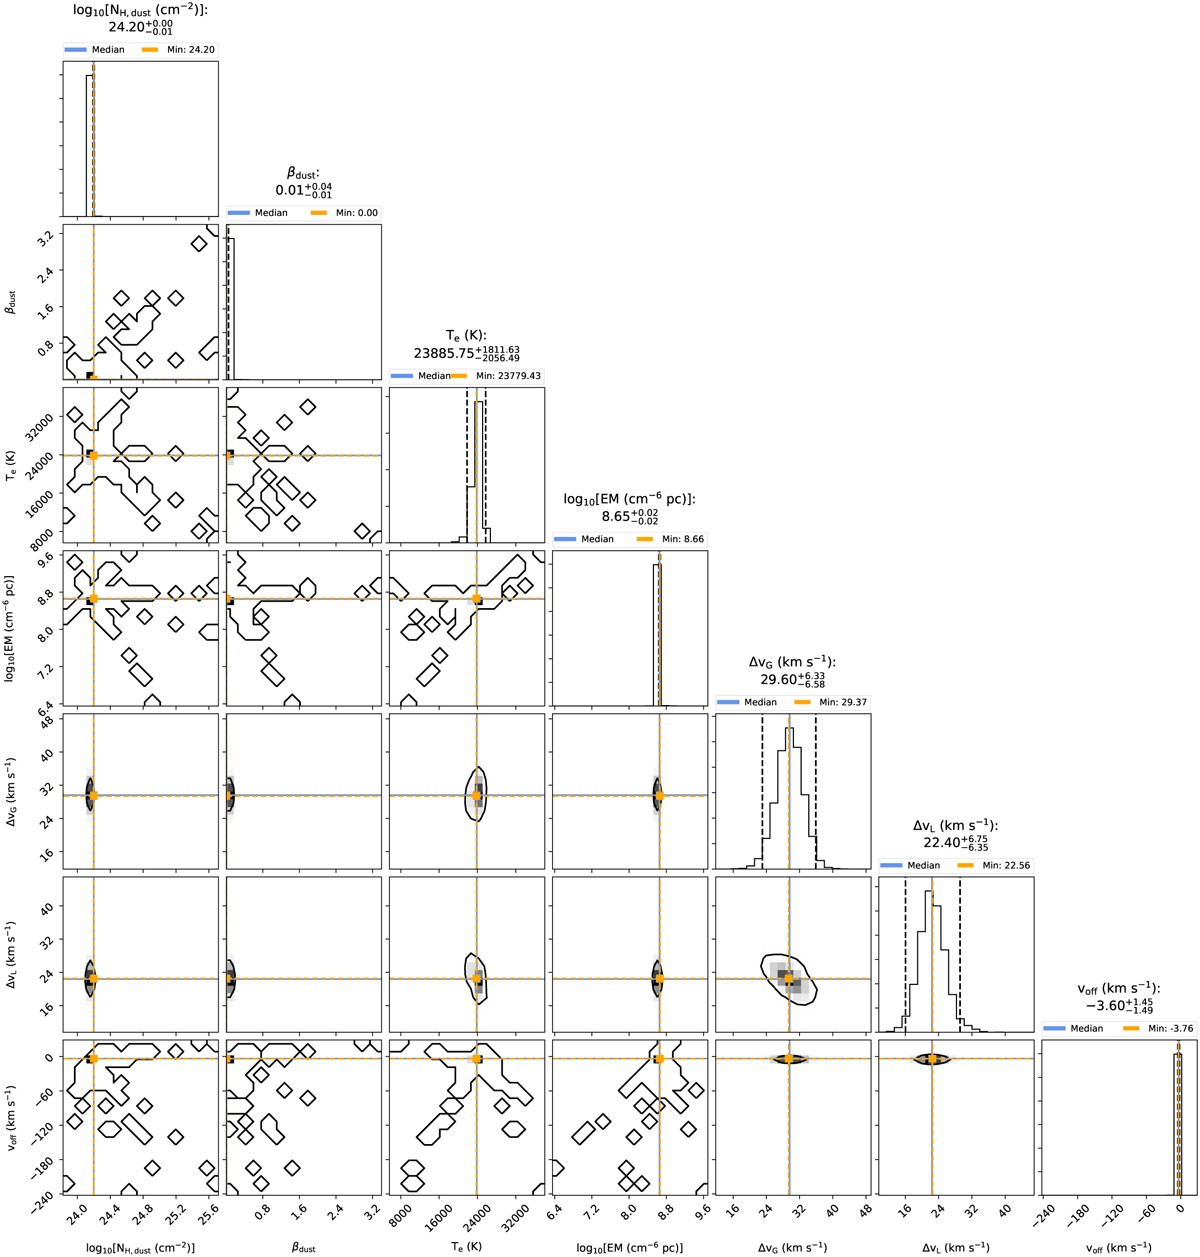
Corner plot (Foreman-Mackey 2016) showing the 1D and 2D projections of the posterior probability distributions of the continuum parameters of core A17, in Sgr B2(M). At the top of each column the probability distribution for each free parameter is shown together with the 50% quantile (median) and the corresponding left and right errors. The left and right dashed lines indicate the lower and upper limits of the corresponding HPD interval, respectively. The blue line indicates the median of the distribution. The dashed orange lines indicate the parameter values of the best fit. The plots in the lower left corner describe the projected 2D histograms of two parameters. For a better estimation of the errors, the error of the hydrogen column density and the emission measure on log10 scale are determined and use the velocity offset (υoff) related to the source velocity of υLSR = 64 km s−1.
Current usage metrics show cumulative count of Article Views (full-text article views including HTML views, PDF and ePub downloads, according to the available data) and Abstracts Views on Vision4Press platform.
Data correspond to usage on the plateform after 2015. The current usage metrics is available 48-96 hours after online publication and is updated daily on week days.
Initial download of the metrics may take a while.