Open Access
Fig. 9
Download original image
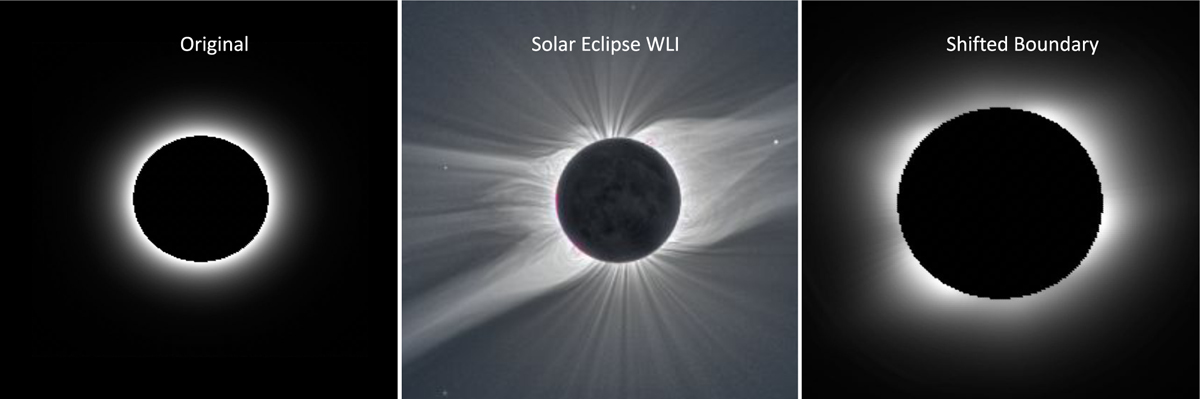
Synthetic WLI for 2008 minimum solar activity case using density profiles from the original approach (left: boundary located at 1.01 R⊙), the new setup (right: boundary located at 2.0 R⊙), and the corresponding eclipse observation (© 2008 Alson Wong) in the middle.
Current usage metrics show cumulative count of Article Views (full-text article views including HTML views, PDF and ePub downloads, according to the available data) and Abstracts Views on Vision4Press platform.
Data correspond to usage on the plateform after 2015. The current usage metrics is available 48-96 hours after online publication and is updated daily on week days.
Initial download of the metrics may take a while.