Fig. 7
Download original image
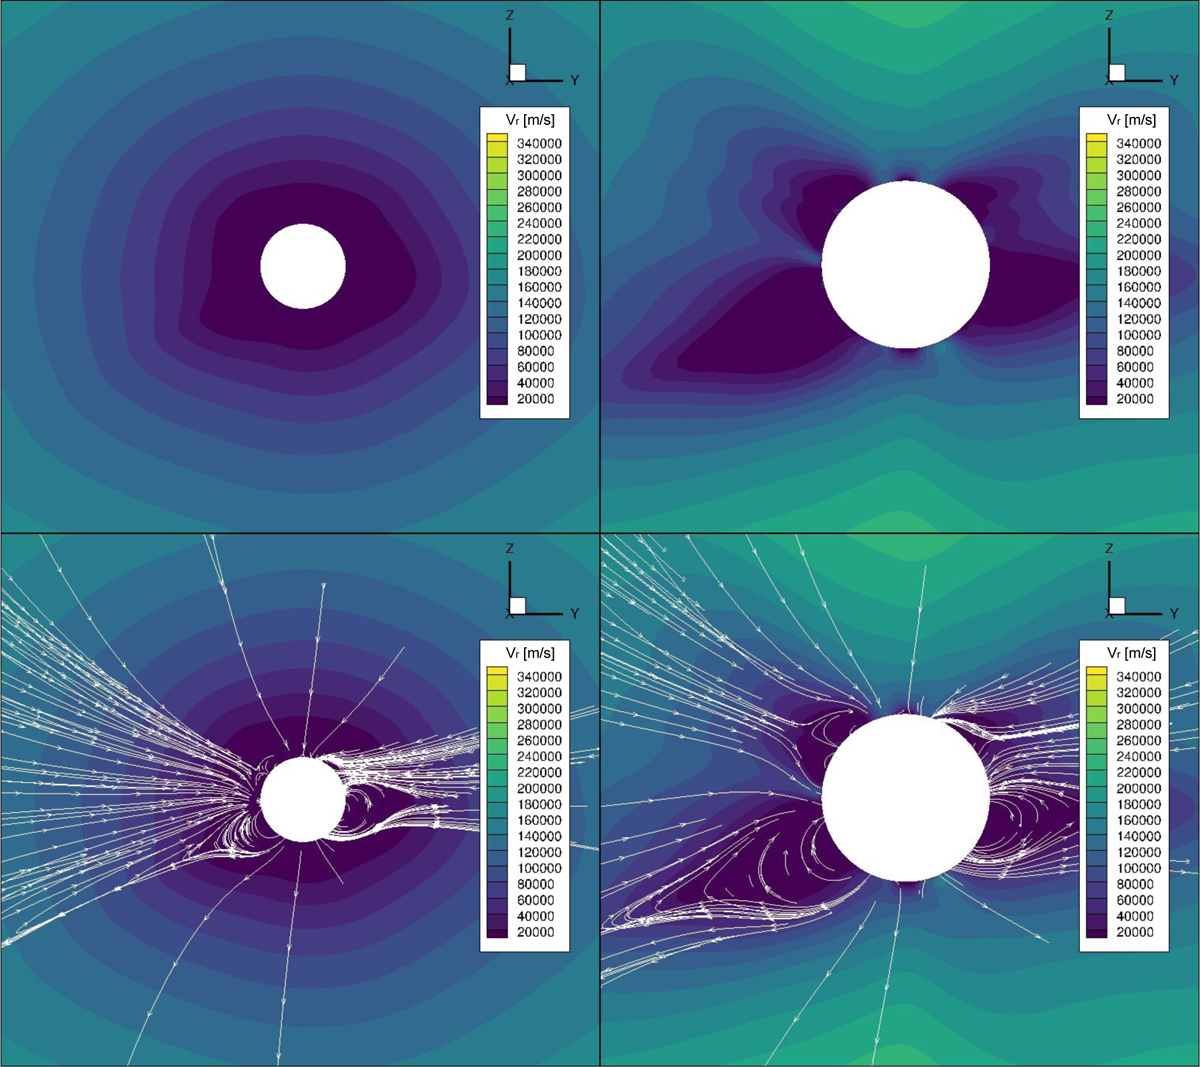
Profiles of the 2008 minimum solar activity case with the original setup (left, boundary located at 1.01 R⊙) and the new setup (right, boundary located at 2.0 R⊙). The top two panels show the radial velocity profiles alone, while the bottom panels also overlay the magnetic field lines (in white) to help ascertain how well the plasma flow follows them.
Current usage metrics show cumulative count of Article Views (full-text article views including HTML views, PDF and ePub downloads, according to the available data) and Abstracts Views on Vision4Press platform.
Data correspond to usage on the plateform after 2015. The current usage metrics is available 48-96 hours after online publication and is updated daily on week days.
Initial download of the metrics may take a while.