Fig. 1
Download original image
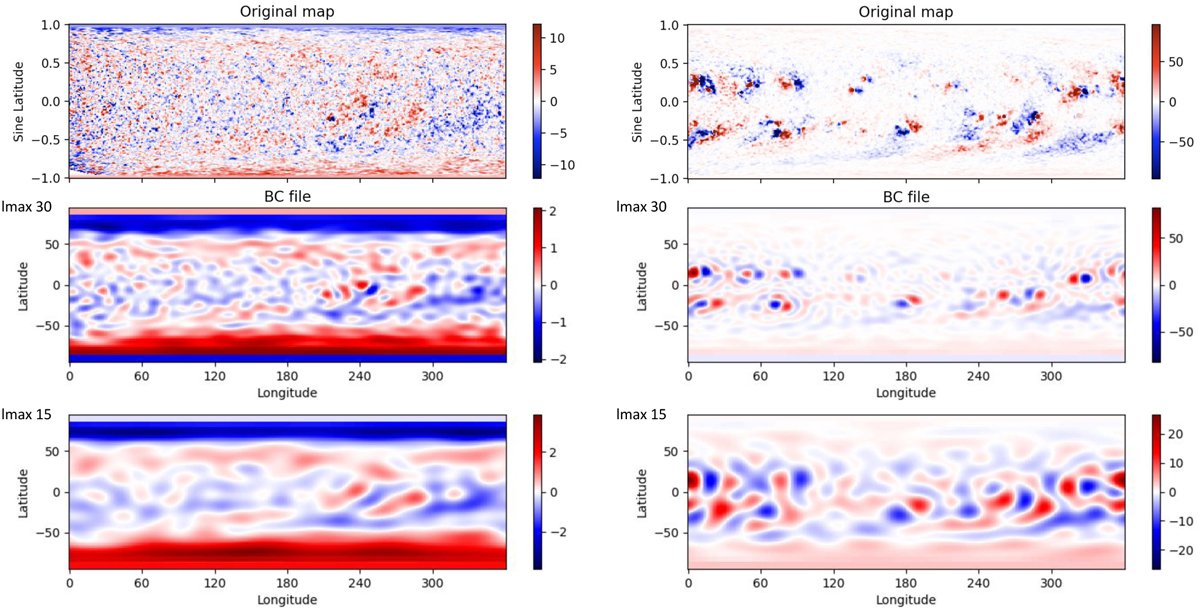
Demonstration of pre-processing of photospheric magnetic maps (top) through spherical harmonics processing, with lmax of 30 (middle) and 15 (bottom). On the left, the magnetic map from the selected minimum of activity case (August 1, 2008 eclipse) is shown. On the right, the magnetic maps correspond to the maximum activity case (November 13, 2012 eclipse). Units are in Gauss.
Current usage metrics show cumulative count of Article Views (full-text article views including HTML views, PDF and ePub downloads, according to the available data) and Abstracts Views on Vision4Press platform.
Data correspond to usage on the plateform after 2015. The current usage metrics is available 48-96 hours after online publication and is updated daily on week days.
Initial download of the metrics may take a while.