Open Access
Fig. A.16
Download original image
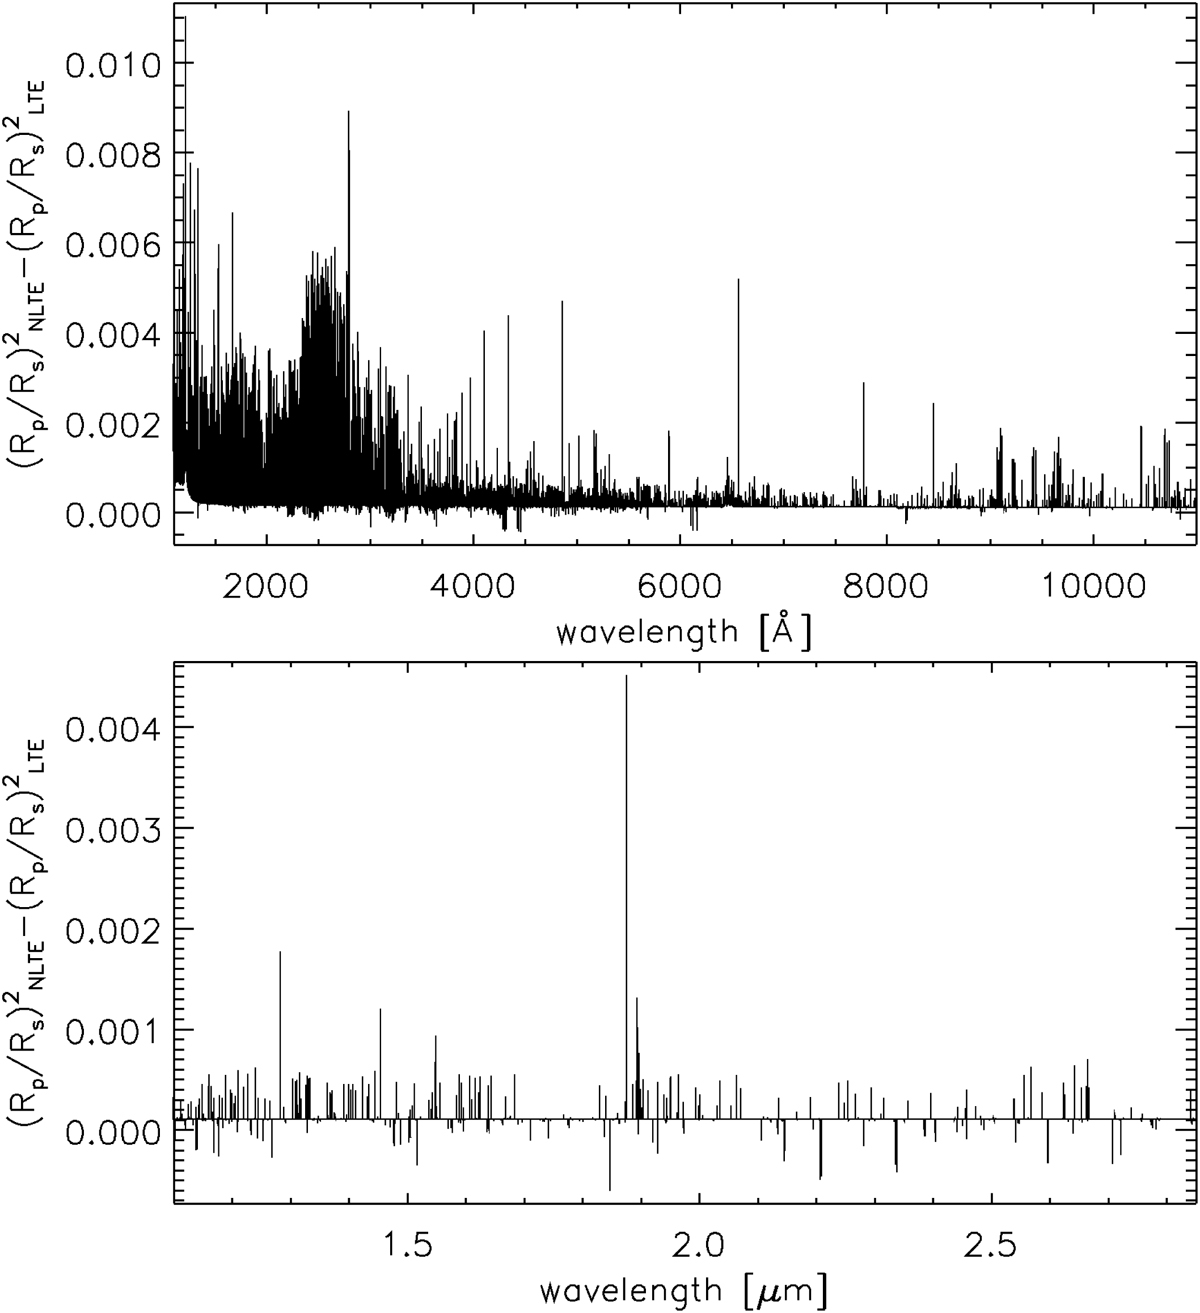
Transit depth difference between the NLTE and LTE transmission spectra shown in Fig. 11. The top plot covers the UV and optical range, while the bottom plot covers the infrared band.
Current usage metrics show cumulative count of Article Views (full-text article views including HTML views, PDF and ePub downloads, according to the available data) and Abstracts Views on Vision4Press platform.
Data correspond to usage on the plateform after 2015. The current usage metrics is available 48-96 hours after online publication and is updated daily on week days.
Initial download of the metrics may take a while.