Fig. A.8
Download original image
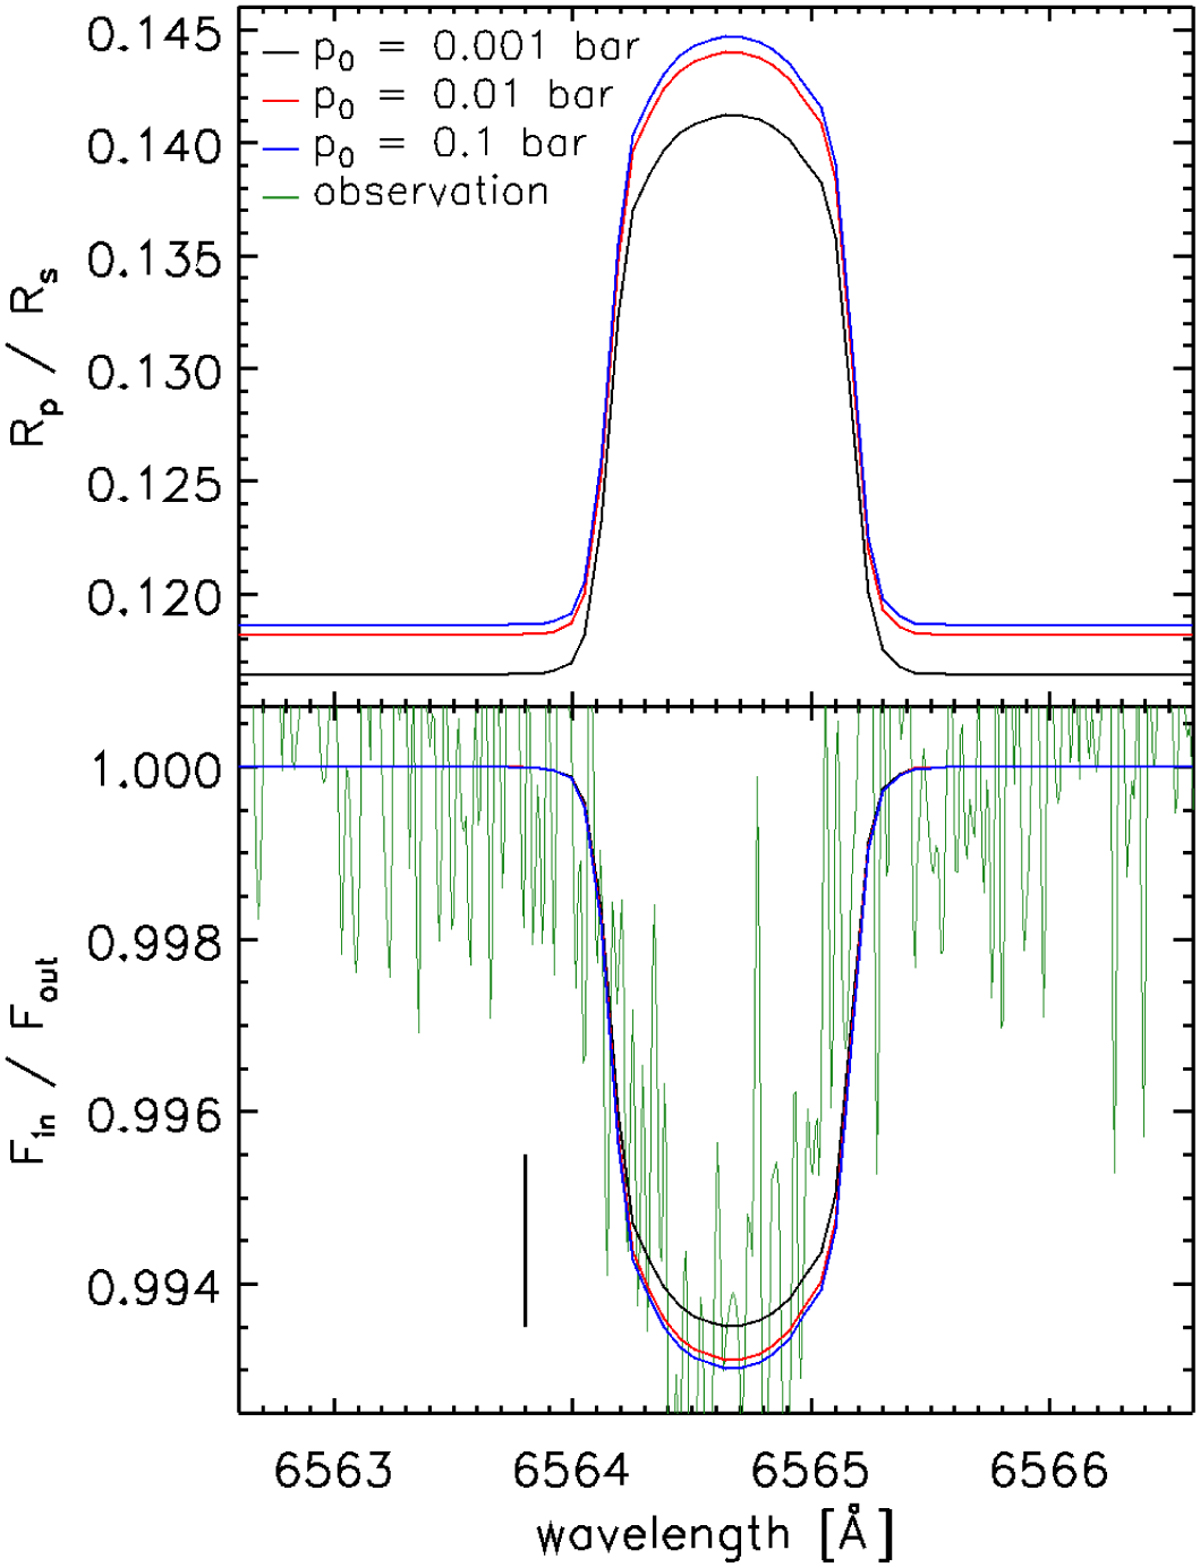
Comparison between CLOUDY synthetic transmission spectra of the Hα line before (top) and after (bottom) normalisation, computed considering different reference pressure levels at 0.001 bar (black), 0.01 bar (red), and 0.1 bar (blue). For reference, in the bottom panel the green line shows the observed Hα transmission spectrum, while the straight black line shows the average 1σ uncertainty obtained from the observations. Wavelengths are in vacuum.
Current usage metrics show cumulative count of Article Views (full-text article views including HTML views, PDF and ePub downloads, according to the available data) and Abstracts Views on Vision4Press platform.
Data correspond to usage on the plateform after 2015. The current usage metrics is available 48-96 hours after online publication and is updated daily on week days.
Initial download of the metrics may take a while.