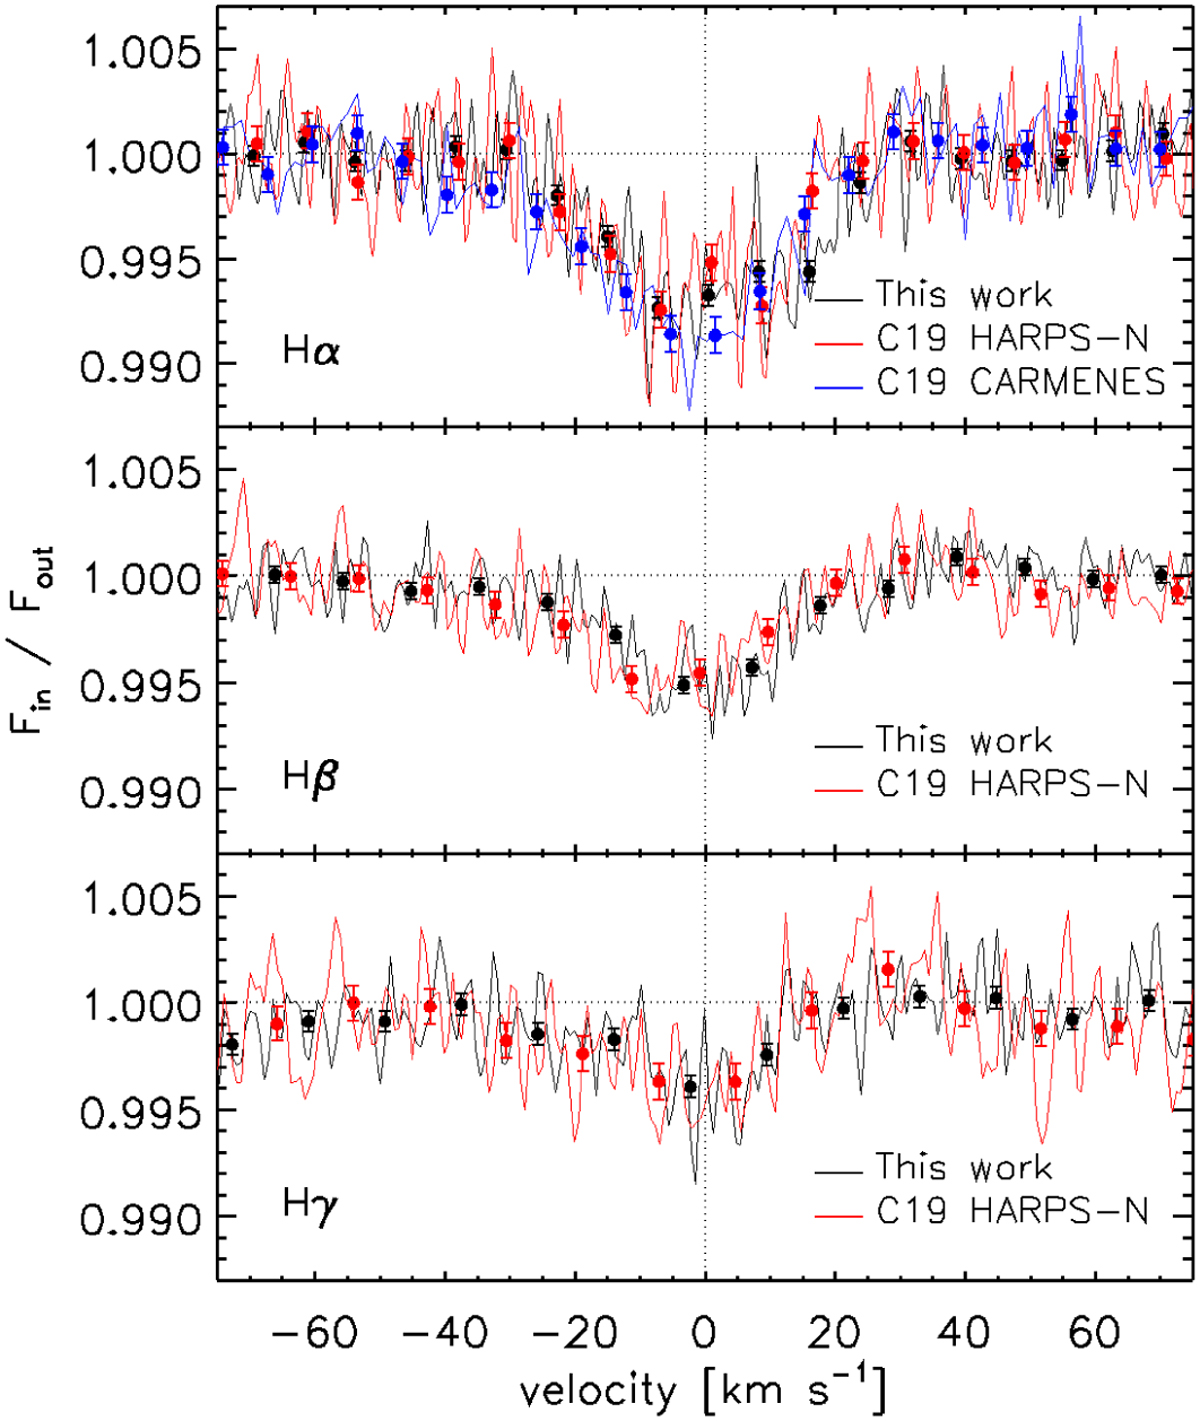
Fig. A.7
Download original image
Comparison between our results obtained from combining six transits observed with HARPS-N (black) and that published by Casasayas-Barris et al. (2019) employing HARPS-N (three transits; red) and CARMENES (one transit; blue). The top, middle, and bottom panels show the comparison for the Hα, Hβ, and Ηγ lines, respectively. The central wavelengths of the Balmer lines (in vacuum) used to convert the wavelengths into velocities are 6564.60 Å for Hα, 4862.71 Å for Hβ, and 4341.69 Å for Ηγ. Lines correspond to the original data, while to guide the eye dots are the data binned to about 7.5 km s−1. The vertical and horizontal dotted lines respectively at zero and one are for reference. The HARPS-N transmission spectra of Casasayas-Barris et al. (2019) are about 20% noisier than those presented here.
Current usage metrics show cumulative count of Article Views (full-text article views including HTML views, PDF and ePub downloads, according to the available data) and Abstracts Views on Vision4Press platform.
Data correspond to usage on the plateform after 2015. The current usage metrics is available 48-96 hours after online publication and is updated daily on week days.
Initial download of the metrics may take a while.