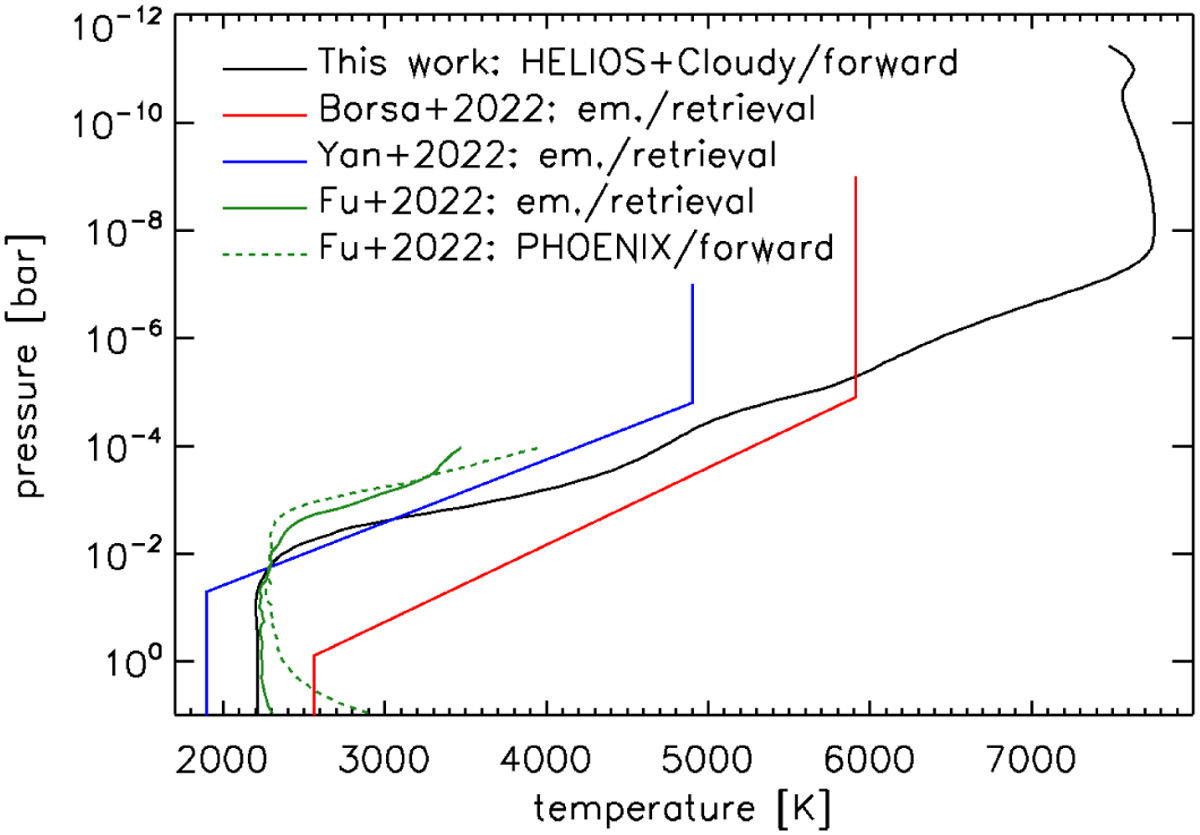
Fig. A.2
Download original image
Comparison between our composite TP profile (black) with those published in the literature retrieved from secondary eclipse observations by Borsa et al. (2022, red), Yan et al. (2022, blue), and Fu et al. (2022, green). As a further comparison, the dashed green line shows the result of the forward model presented by Fu et al. (2022). We recall that the retrieved profiles are an average over the illuminated planet disk; the black line is computed for the sub-stellar point.
Current usage metrics show cumulative count of Article Views (full-text article views including HTML views, PDF and ePub downloads, according to the available data) and Abstracts Views on Vision4Press platform.
Data correspond to usage on the plateform after 2015. The current usage metrics is available 48-96 hours after online publication and is updated daily on week days.
Initial download of the metrics may take a while.