Fig. A.1
Download original image
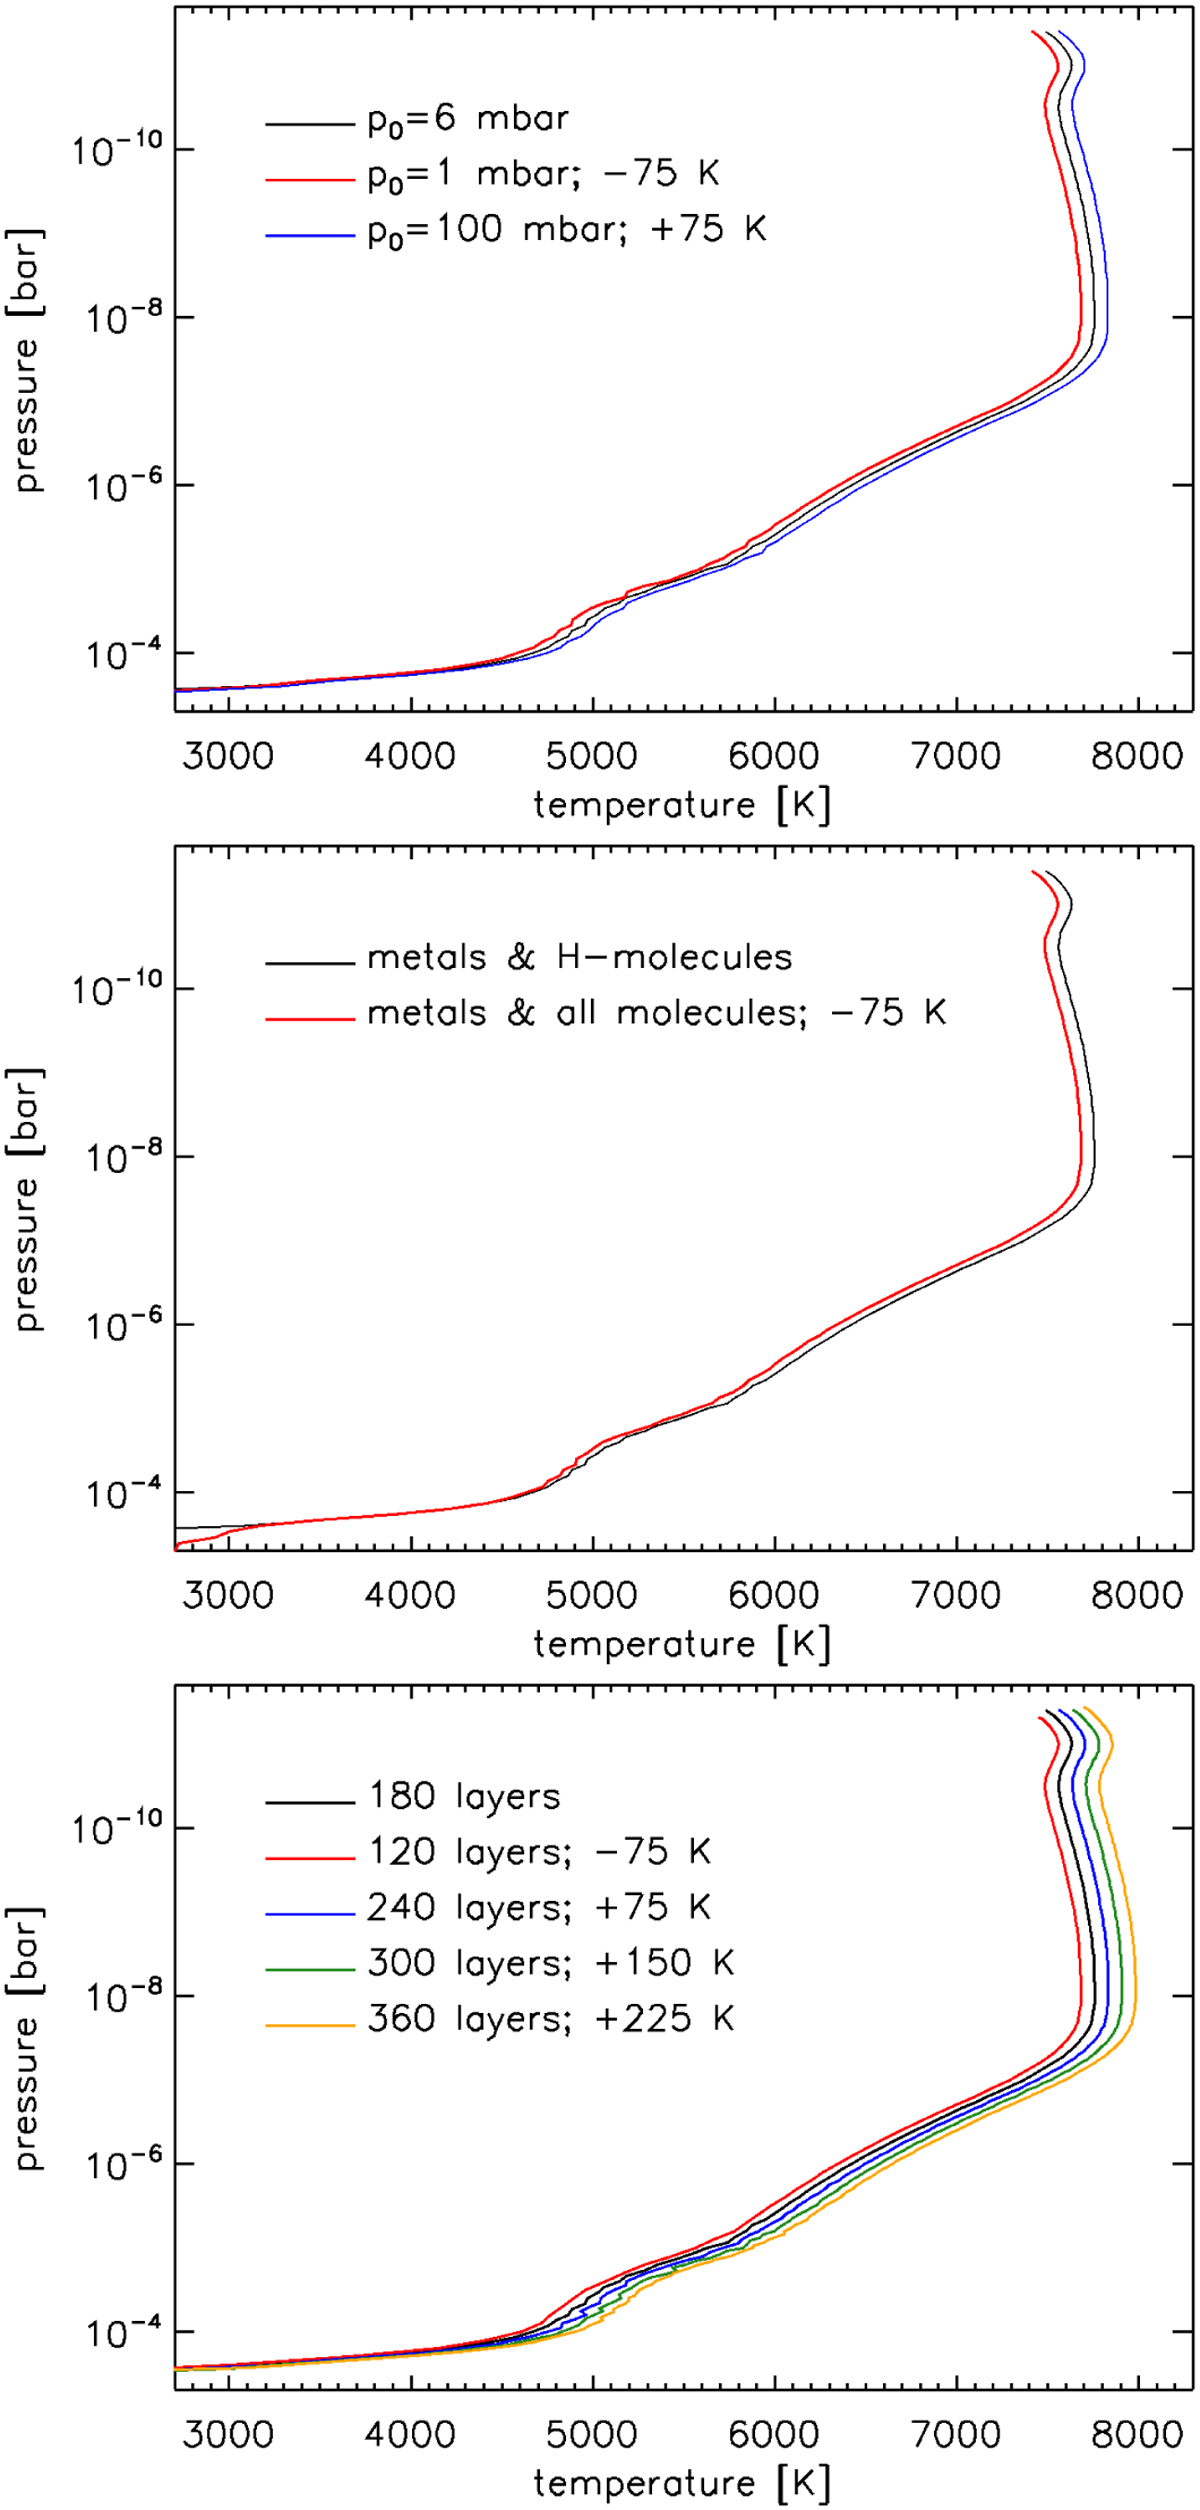
Comparison among TP profiles computed considering different assumptions for reference pressure, atmospheric composition, and number of layers. Top: Comparison between CLOUDY TP profiles obtained when fixing the planetary transit radius to the reference pressure (p0) values of 100 mbar (blue), 6 mbar (black), and 1 mbar (red). Middle: Comparison between CLOUDY TP profiles computed when accounting for metals plus only hydrogen molecules (black) and for metals plus all molecules present in the CLOUDY database (red). Bottom: Comparison between CLOUDY TP profiles obtained considering different numbers of layers, as indicated in the legend. For visualisation purposes, the TP profiles are rigidly shifted horizontally by the value indicated in the legend.
Current usage metrics show cumulative count of Article Views (full-text article views including HTML views, PDF and ePub downloads, according to the available data) and Abstracts Views on Vision4Press platform.
Data correspond to usage on the plateform after 2015. The current usage metrics is available 48-96 hours after online publication and is updated daily on week days.
Initial download of the metrics may take a while.