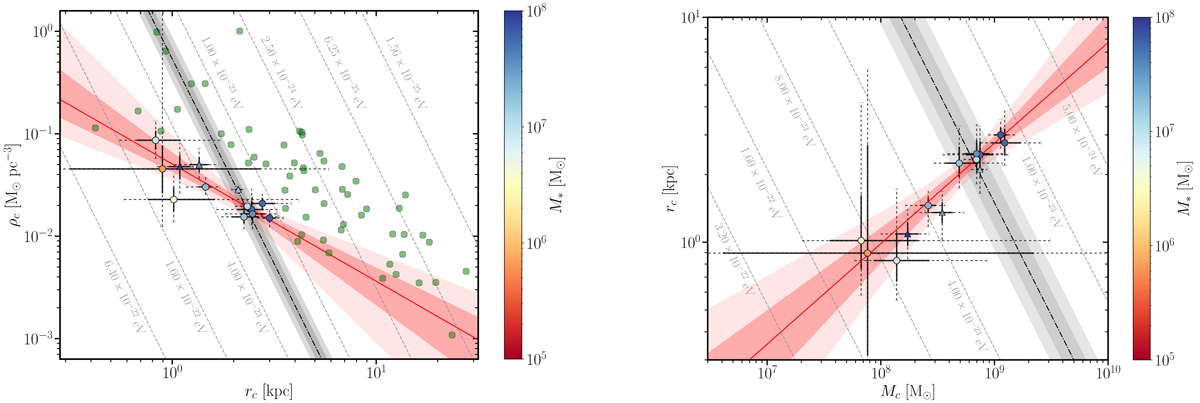
Fig. 5.
Download original image
Soliton scaling relations compared to the results of the fits to LTs, where each point is colored according to the value of M⋆ of the corresponding galaxy. Dot-dashed lines and gray bands represent the mean and the 68% and 95% CL regions for the correlation expected from FDM for the average axion mass in Eq. (23). The solid line and surrounding bands represent the maximum posterior and 68% and 95% CL regions of the fit to a power law of the results extracted from the individual galaxies. Left: Results in the rc − ρc plane compared to Eq. (8) and where we also show the results obtained independently for a different sample of galaxies by using a Burkert profile (Rodrigues et al. 2017; Deng et al. 2018). Right: Results in the rc − Mc plane compared to Eq. (8).
Current usage metrics show cumulative count of Article Views (full-text article views including HTML views, PDF and ePub downloads, according to the available data) and Abstracts Views on Vision4Press platform.
Data correspond to usage on the plateform after 2015. The current usage metrics is available 48-96 hours after online publication and is updated daily on week days.
Initial download of the metrics may take a while.