Fig. 4.

Download original image
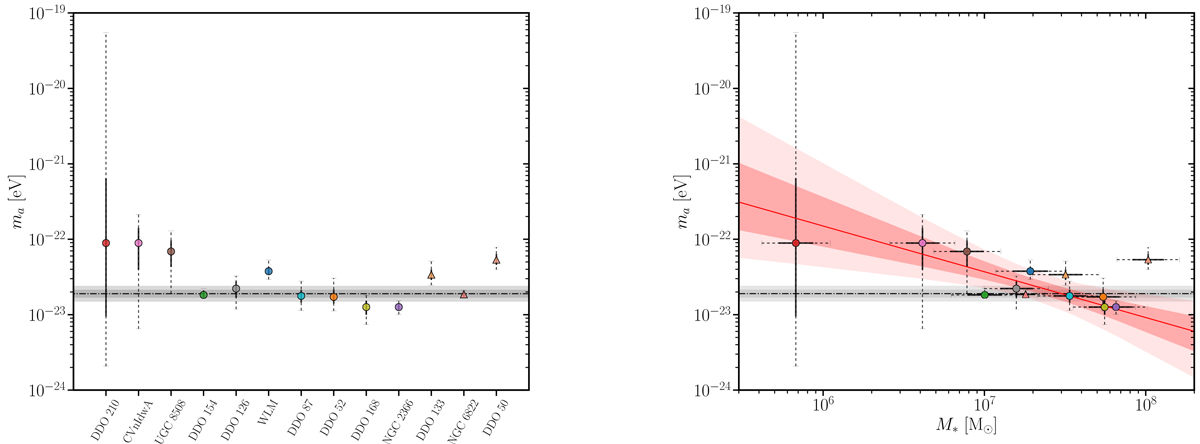
Axion masses obtained from the posterior distributions of the fits to the rotation curves of the LTs galaxies where we show medians and 68% and 95% CL errors. The 10 galaxies entering our fiducial analysis are represented by circles while the rogues are represented by triangles. The dot-dashed line and bands represent the mean, 68% and 95% CL regions of a weighted average to these determinations (see Eq. (23) and associated discussion). Left: Galaxies are ordered by the central value of the stellar mass reported in Read et al. (2017), which where found to be in good agreement with our posterior distributions. Stellar masses are increasing from left to right. Right: Empirical fit to a power law between ma and M⋆ showing evidence for a correlation between the two as extracted from the galaxies in our sample. The red solid line denotes the maximum posterior fit with the 68% and 95% CL regions.
Current usage metrics show cumulative count of Article Views (full-text article views including HTML views, PDF and ePub downloads, according to the available data) and Abstracts Views on Vision4Press platform.
Data correspond to usage on the plateform after 2015. The current usage metrics is available 48-96 hours after online publication and is updated daily on week days.
Initial download of the metrics may take a while.


