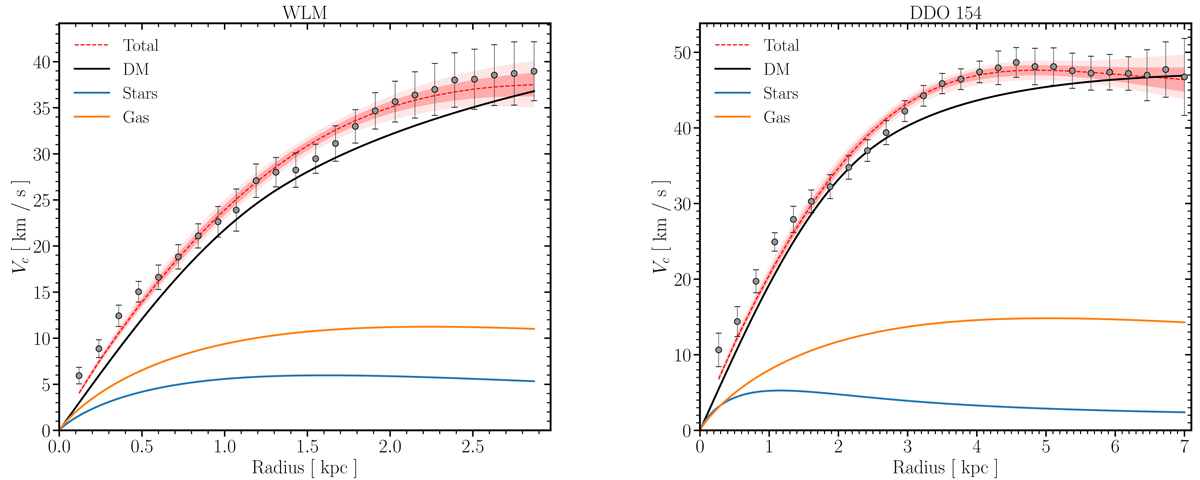
Fig. 2.
Download original image
Rotation curves in FDM for two representative galaxies in the LTs catalog, WLM, and DDO 154. We plot the DM, gas, and stellar components obtained from the fits (maximum posterior values) and compared to the data. The red dashed lines are the median of the posterior distribution for the total velocity and the colored band is the corresponding uncertainty at 68% and 95% CL.
Current usage metrics show cumulative count of Article Views (full-text article views including HTML views, PDF and ePub downloads, according to the available data) and Abstracts Views on Vision4Press platform.
Data correspond to usage on the plateform after 2015. The current usage metrics is available 48-96 hours after online publication and is updated daily on week days.
Initial download of the metrics may take a while.