Fig. A.4.
Download original image
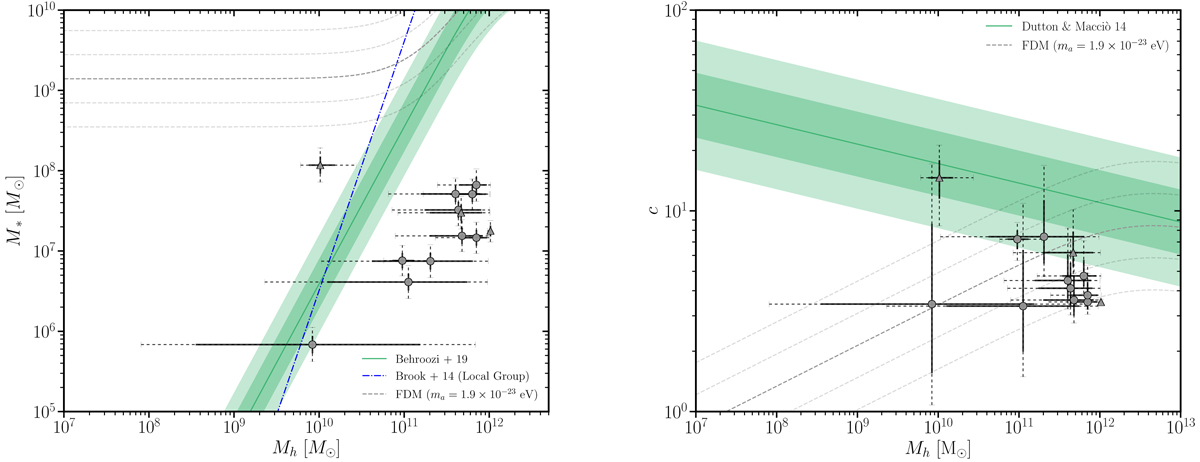
Median values of posterior distributions for the NFW model compared with M* − Mh (top) and c − Mh (bottom) relations. Uncertainties in the data points describe the 68% (solid) and 95% (dashed) CL ranges. The green bands describe ±1 and 2 σ scatter with σ = 0.3 dex for the top panel and σ = 0.16 dex for the bottom panel. Results for FDM are included for comparison.
Current usage metrics show cumulative count of Article Views (full-text article views including HTML views, PDF and ePub downloads, according to the available data) and Abstracts Views on Vision4Press platform.
Data correspond to usage on the plateform after 2015. The current usage metrics is available 48-96 hours after online publication and is updated daily on week days.
Initial download of the metrics may take a while.