Fig. A.1.
Download original image
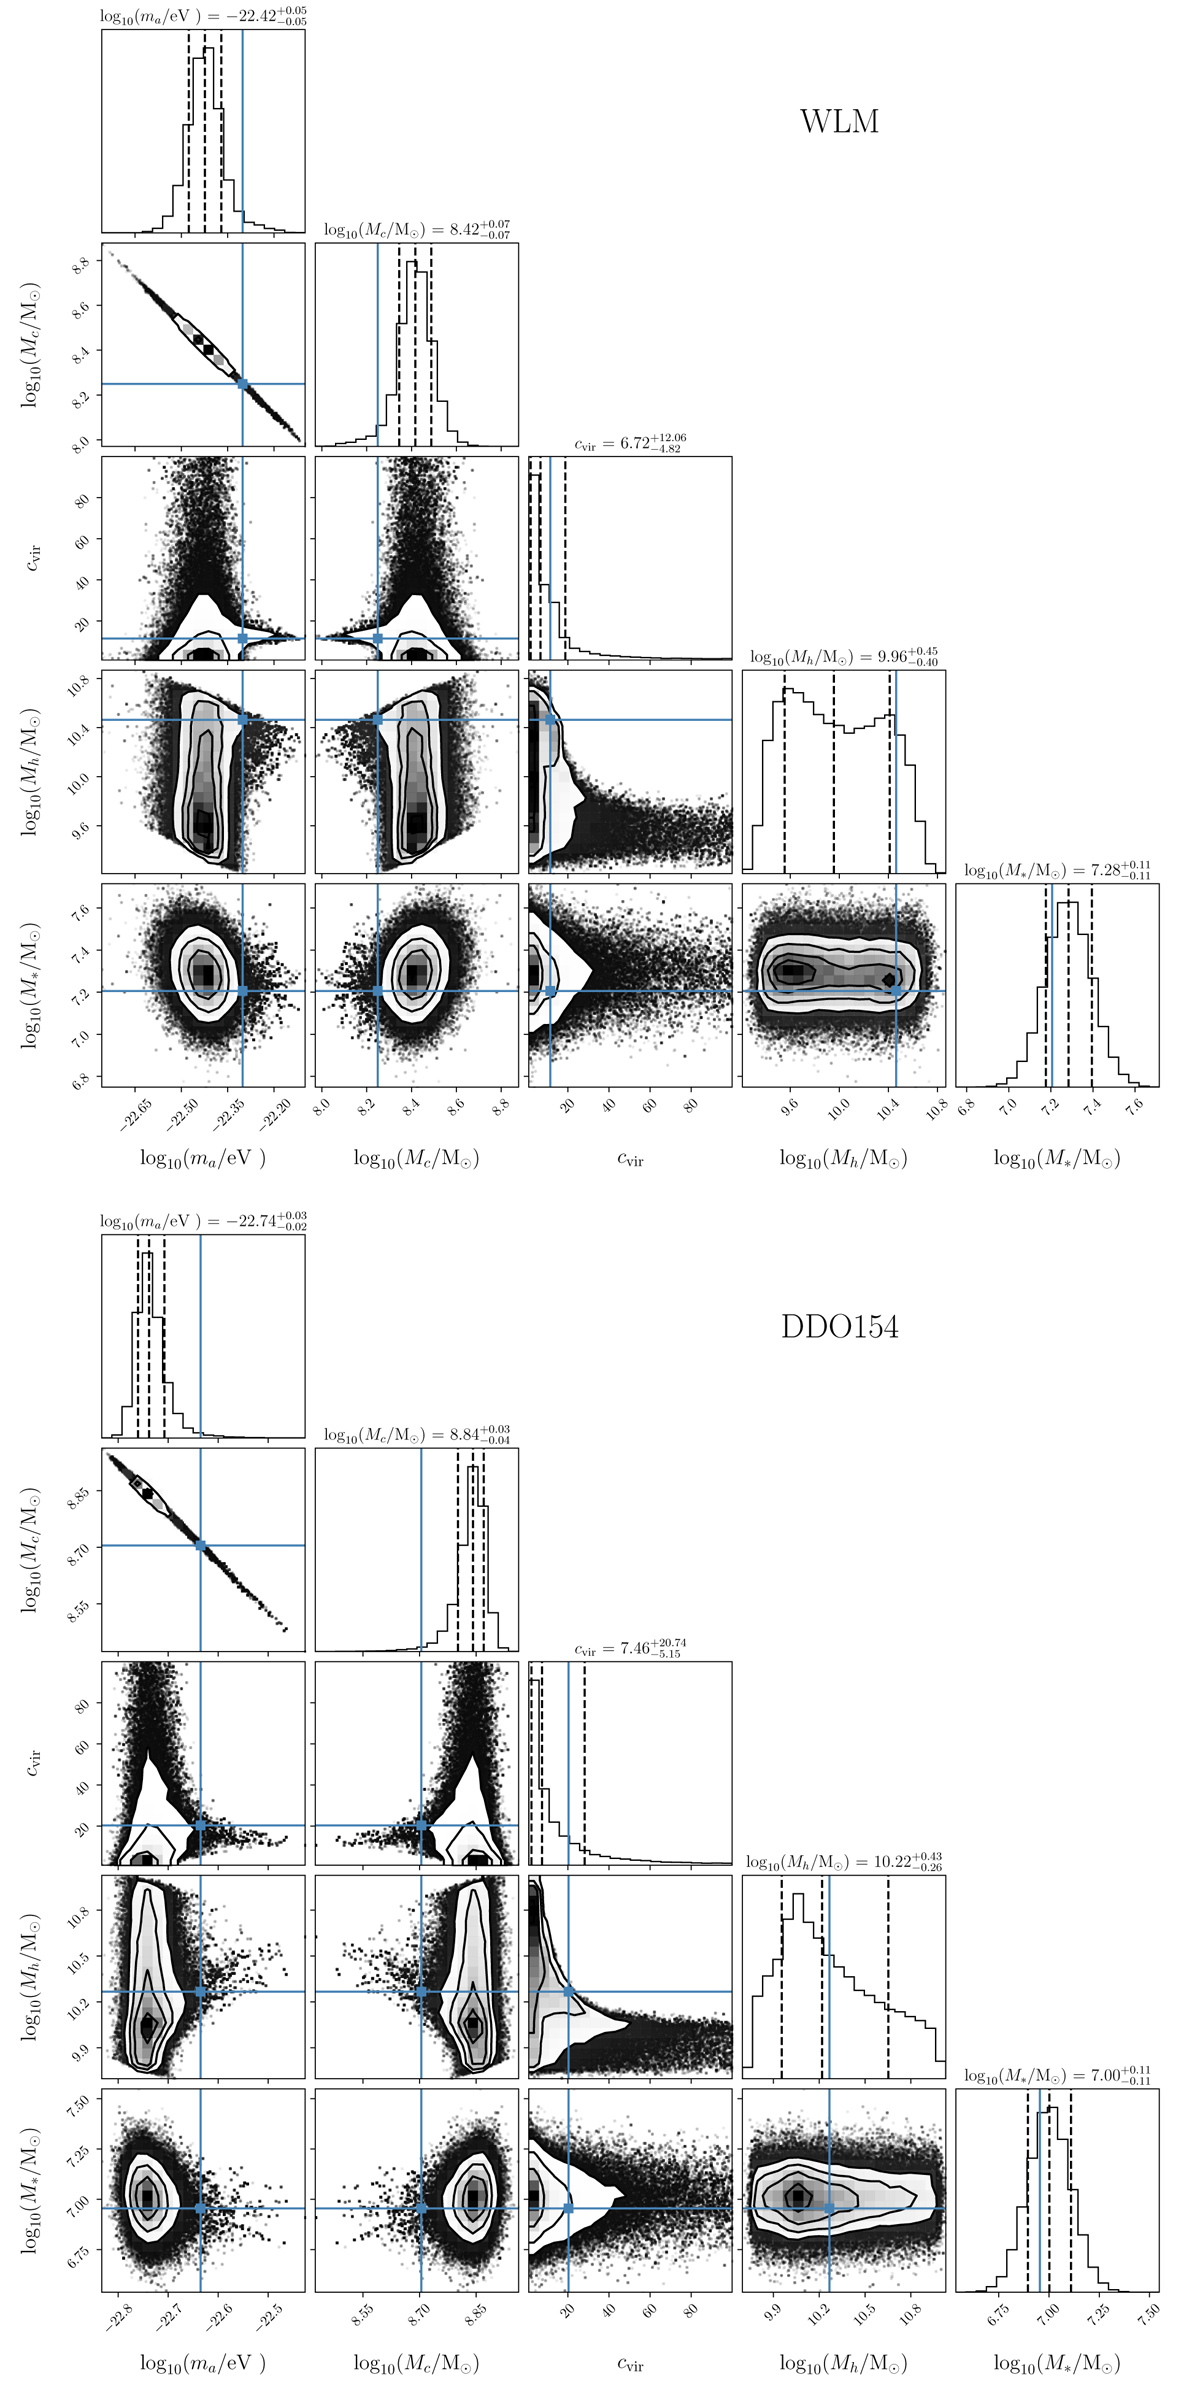
Corner and 1D posterior marginalized distributions for the fitting parameters θFDM and M⋆ in the FDM plus baryons model for the two benchmark galaxies: WLM (top panel) and DDO 154 (bottom panel). Posteriors in the 1D plots show the 16%, 50%, and 84% CL ranges. The priors are shown in Table 1 and the blue lines and dots indicate the maximum posterior values of the parameters from the MCMC samples. Contours in the 2D plots display the ∼39.3%, 67.5%, and 86.4% CL regions, corresponding to the 1, 1.5, and 2σ regions of a 2D normal distribution. Cases where an additional inner contour is present denote an ∼11.8% CL or 0.5σ region.
Current usage metrics show cumulative count of Article Views (full-text article views including HTML views, PDF and ePub downloads, according to the available data) and Abstracts Views on Vision4Press platform.
Data correspond to usage on the plateform after 2015. The current usage metrics is available 48-96 hours after online publication and is updated daily on week days.
Initial download of the metrics may take a while.