Fig. 8.
Download original image
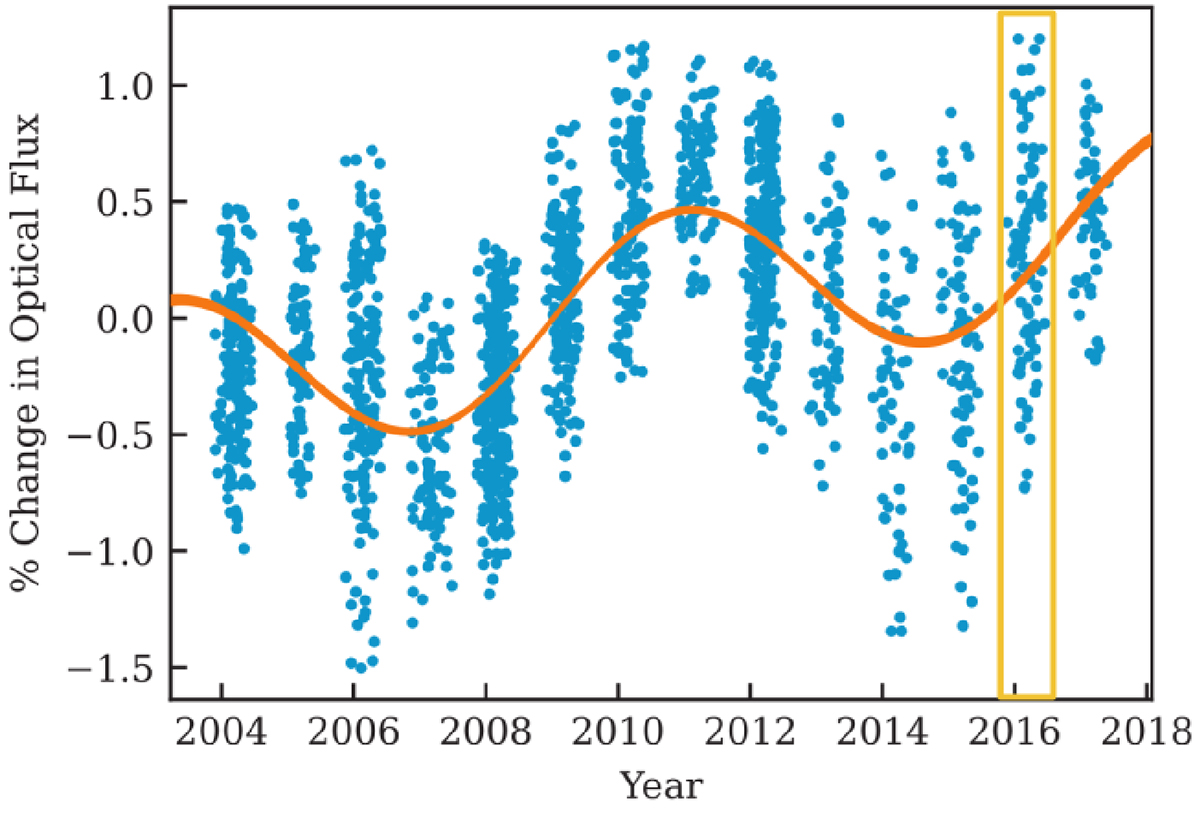
Photometric cycle reported in Lothringer et al. (2018) and Loyd et al. (2023). Blue data points represent the photometric observations, while the orange line represents the sinusoidal fit at a period of 7.75 yr combined with a linear trend. The yellow box on the right of the plot indicates the time window of our Narval observations in 2016. The figure was adapted from Loyd et al. (2023).
Current usage metrics show cumulative count of Article Views (full-text article views including HTML views, PDF and ePub downloads, according to the available data) and Abstracts Views on Vision4Press platform.
Data correspond to usage on the plateform after 2015. The current usage metrics is available 48-96 hours after online publication and is updated daily on week days.
Initial download of the metrics may take a while.