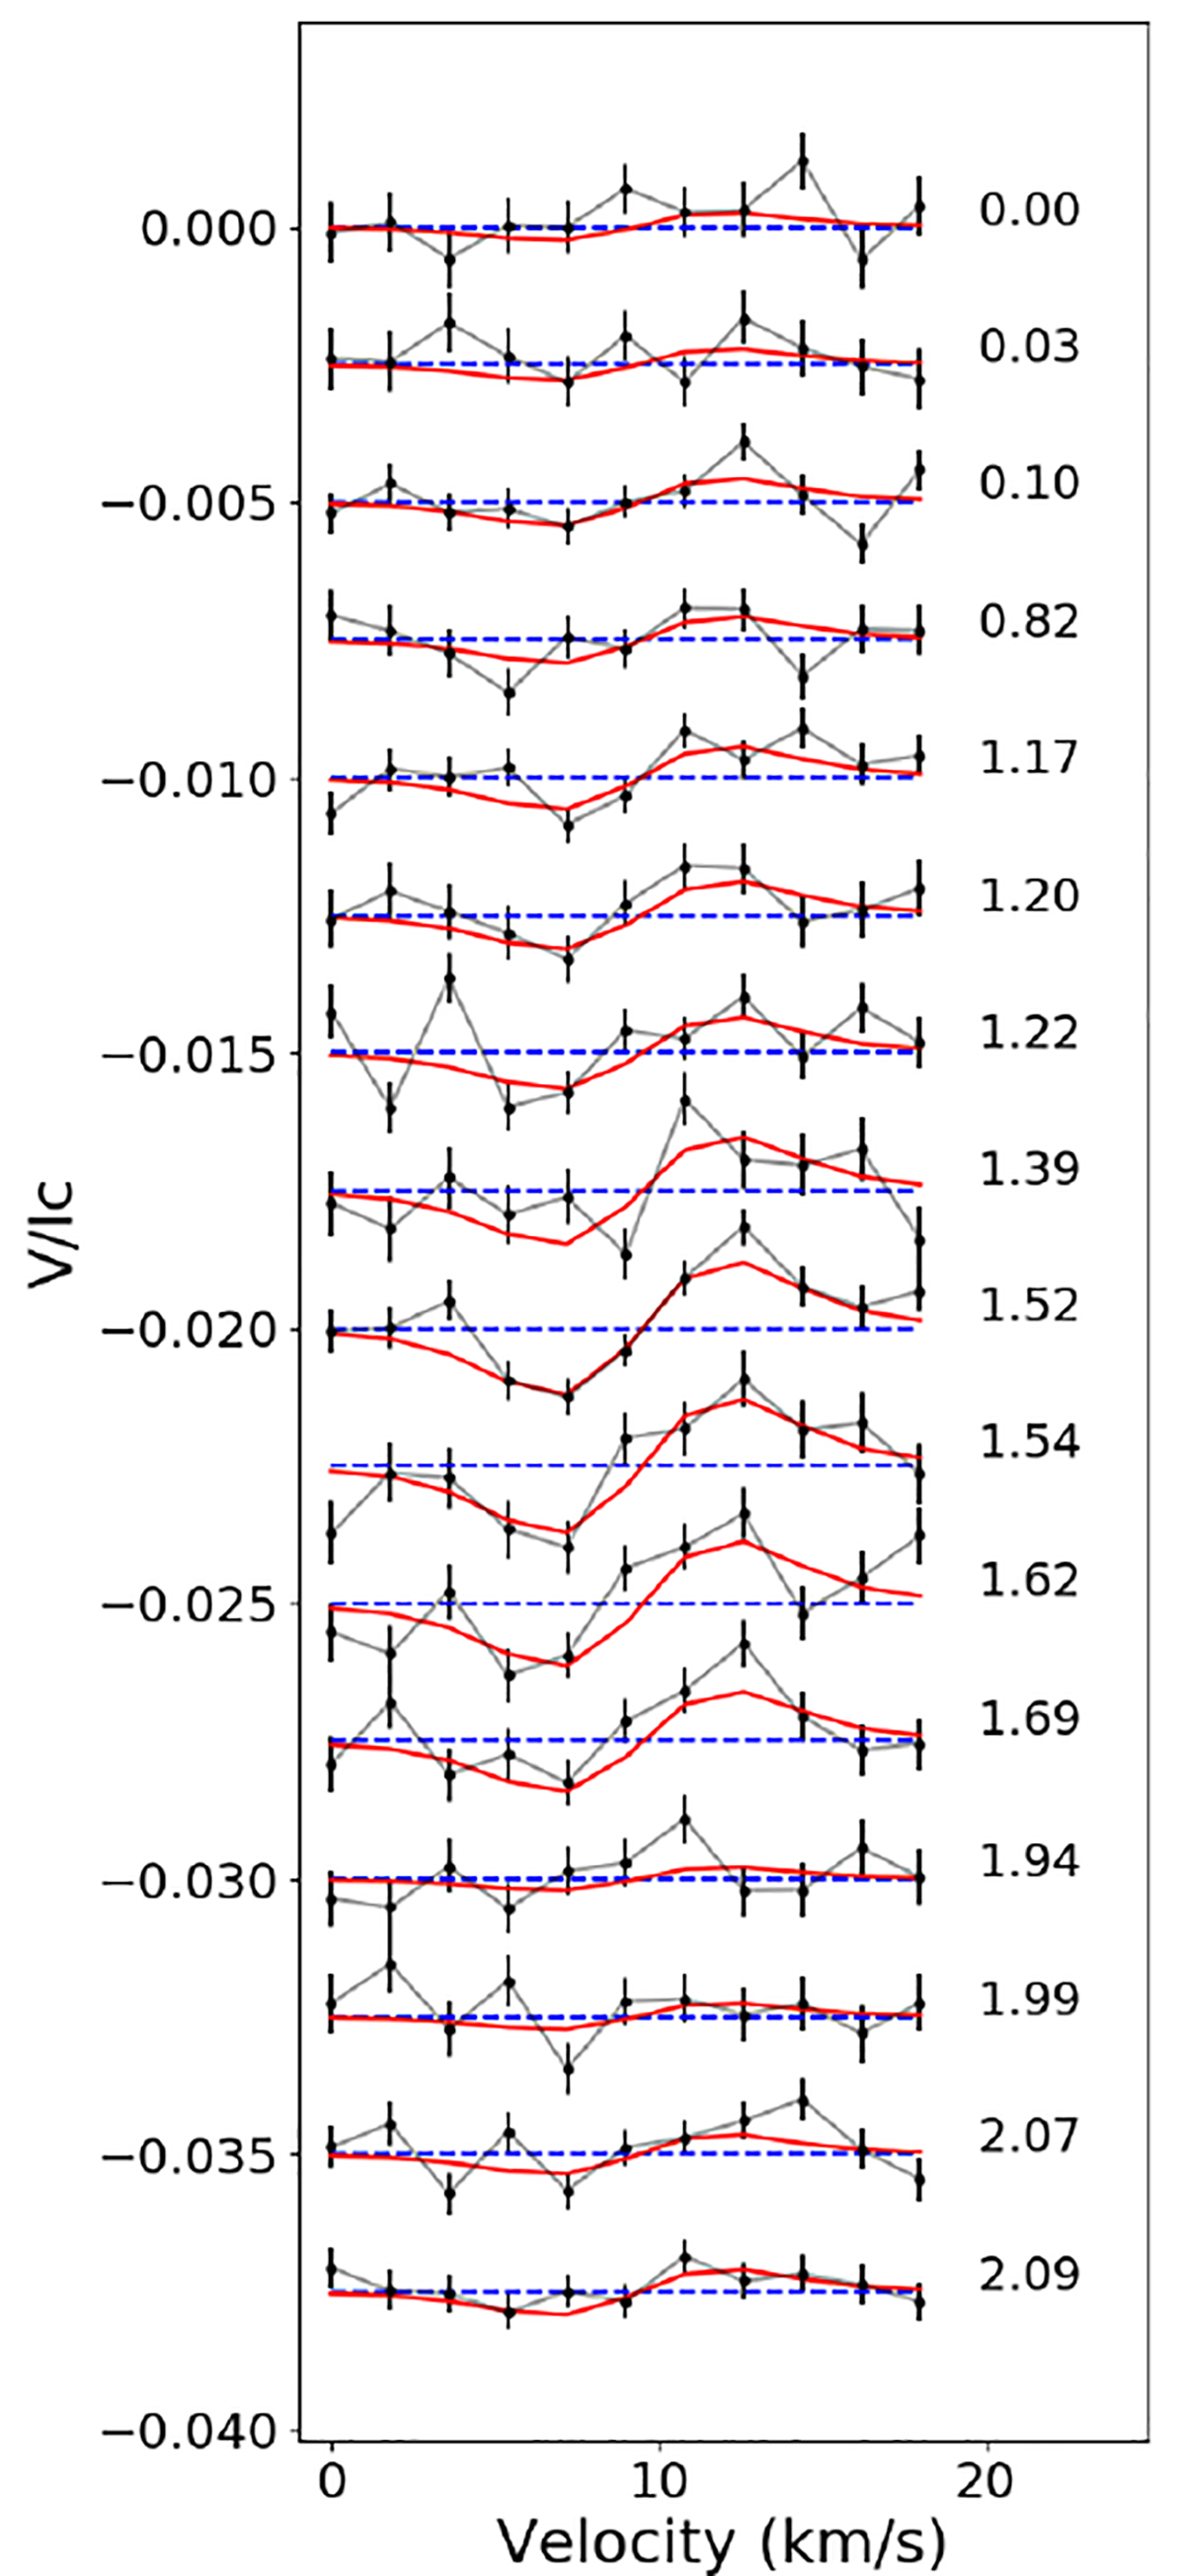
Fig. 4.

Download original image
Narval time series of circularly polarised Stokes profiles. Observations are shown as black dots and ZDI models as red lines, and they are offset vertically for better visualisation. The number on the right indicates the rotational cycle (see Eq. (1)). All signatures are antisymmetric, indicating that we are seeing the negative polarity of a dipole, and the moderate variation in amplitude is symbolic of a small tilt of the magnetic axis.
Current usage metrics show cumulative count of Article Views (full-text article views including HTML views, PDF and ePub downloads, according to the available data) and Abstracts Views on Vision4Press platform.
Data correspond to usage on the plateform after 2015. The current usage metrics is available 48-96 hours after online publication and is updated daily on week days.
Initial download of the metrics may take a while.


