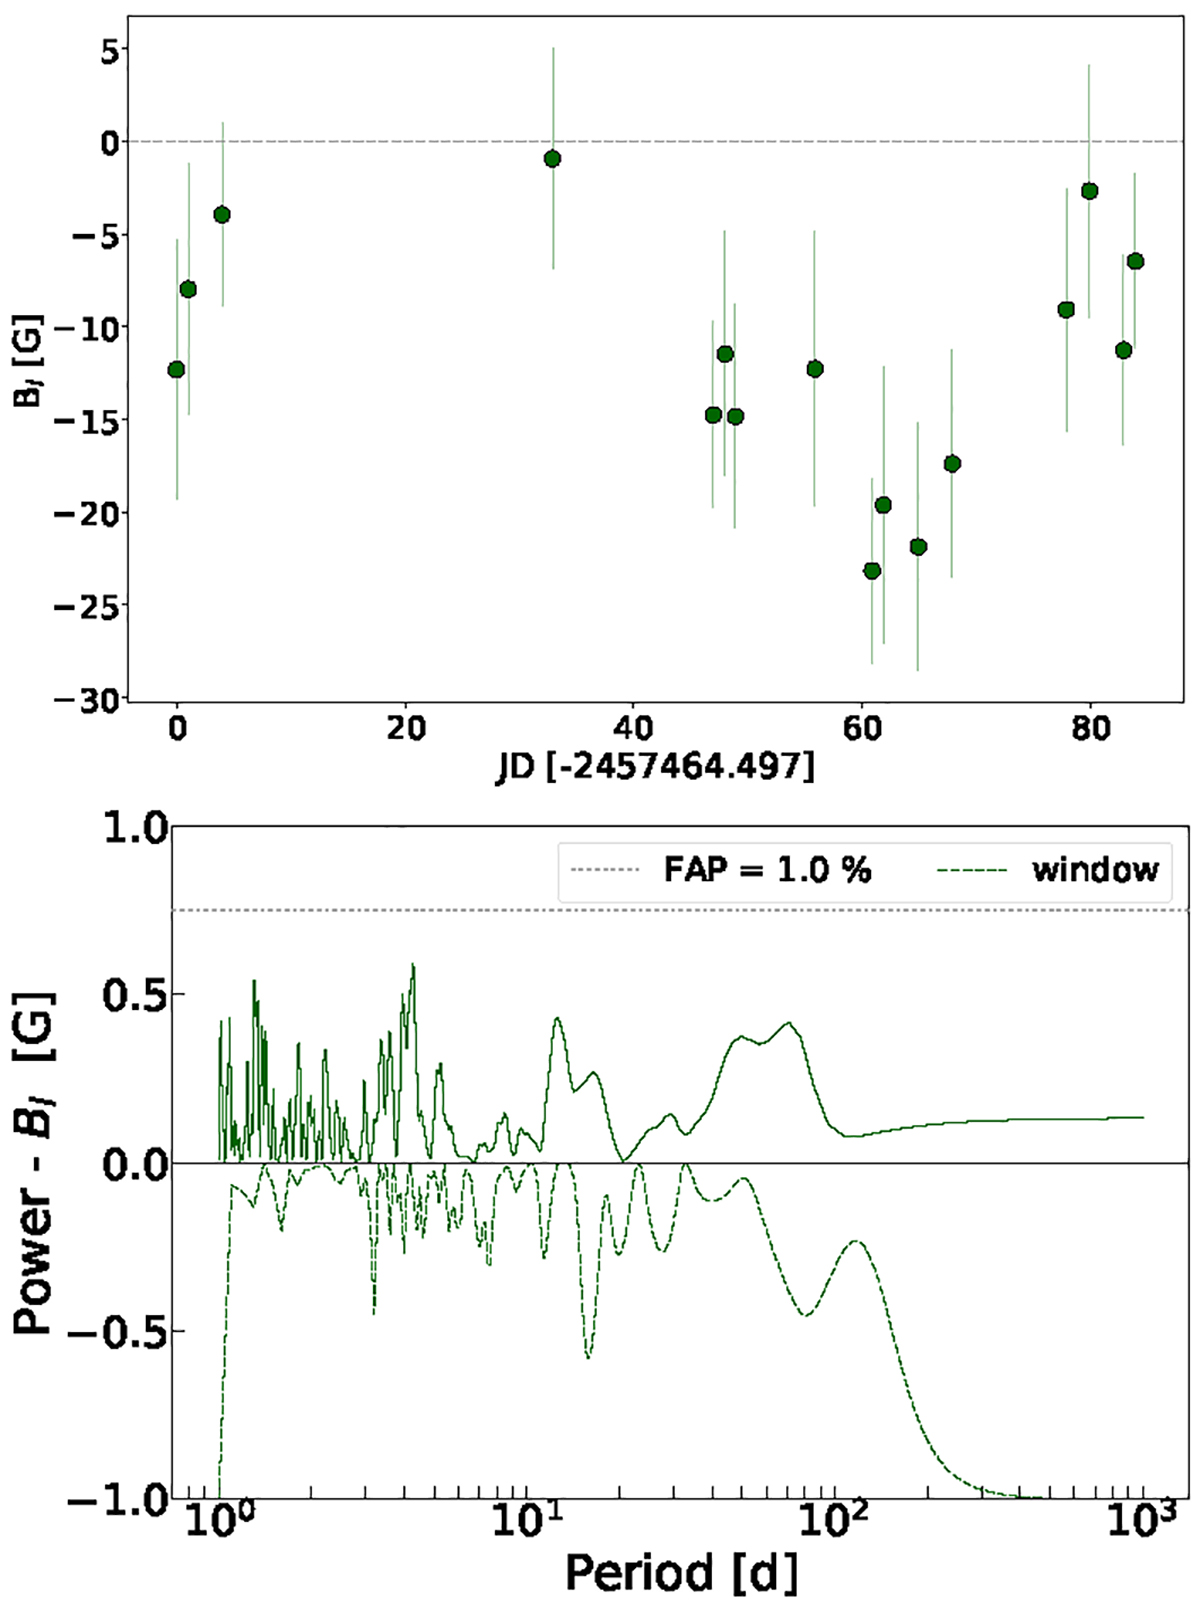
Fig. 2.
Download original image
Analysis of longitudinal field measurements. Top: time series of Bl measurements. All values have a negative sign, and range between −1 and −23 G. Bottom: generalised Lomb-Scargle periodogram of the longitudinal field time series. The analysis does not yield any significant (FAP < 1%) periodicity. The window function of the entire time series has been included and is mirrored with respect to the x axis (VanderPlas 2018), to highlight aliases due to the observation cadence.
Current usage metrics show cumulative count of Article Views (full-text article views including HTML views, PDF and ePub downloads, according to the available data) and Abstracts Views on Vision4Press platform.
Data correspond to usage on the plateform after 2015. The current usage metrics is available 48-96 hours after online publication and is updated daily on week days.
Initial download of the metrics may take a while.