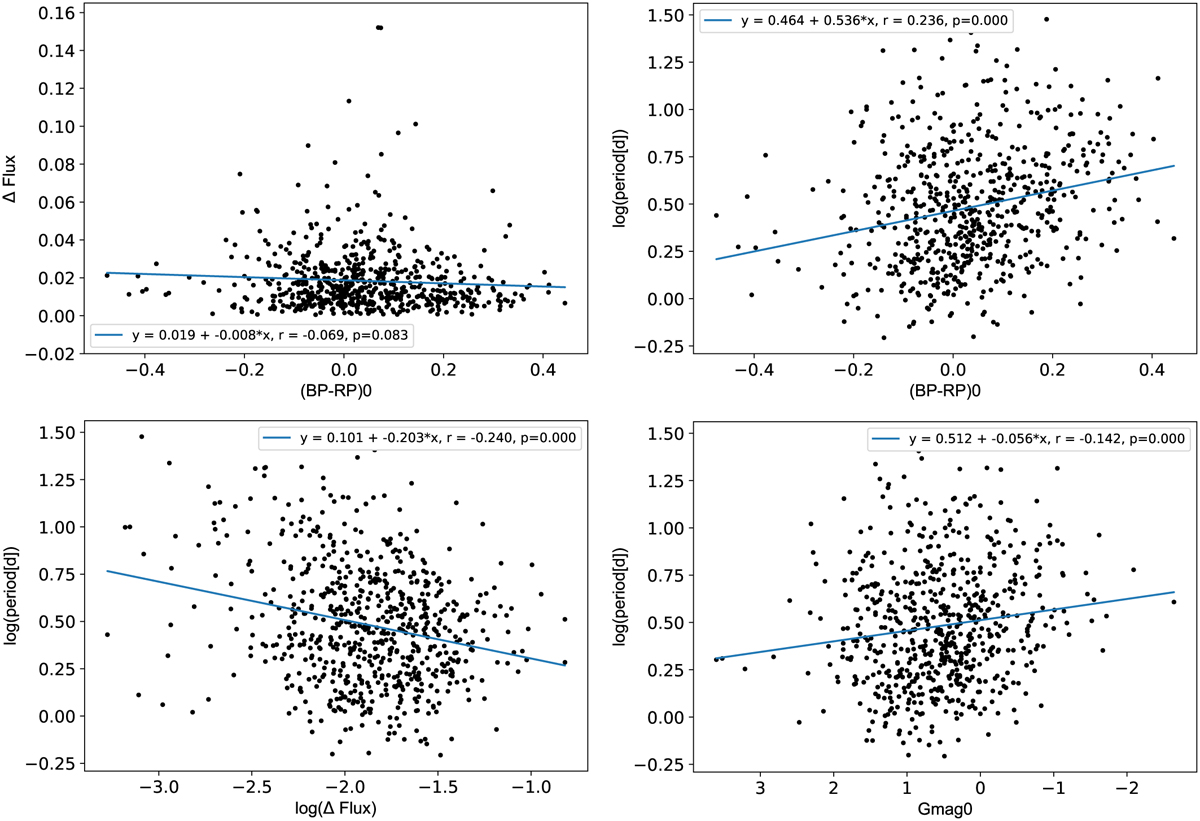
Fig. B.1
Download original image
Correlations between several observables for the sub-sample of 720 stars with accurately determined photometric variability in TESS data. The panels investigate photometric peak-to-peak amplitude versus de-reddened colour index (BP − RP)0 (upper-left panel), logarithmic distribution of rotation periods versus de-reddened colour index (BP − RP)0 (upper-right panel), logarithmic distribution of rotation periods versus logarithmic photometric peak-to-peak amplitude (lower-left panel), and logarithmic distribution of rotation periods versus intrinsic absolute magnitude in the G band (lower-right panel). The blue lines illustrate a linear regression fit to the data. Coefficients and p values from the regression analysis are indicated in the insets.
Current usage metrics show cumulative count of Article Views (full-text article views including HTML views, PDF and ePub downloads, according to the available data) and Abstracts Views on Vision4Press platform.
Data correspond to usage on the plateform after 2015. The current usage metrics is available 48-96 hours after online publication and is updated daily on week days.
Initial download of the metrics may take a while.