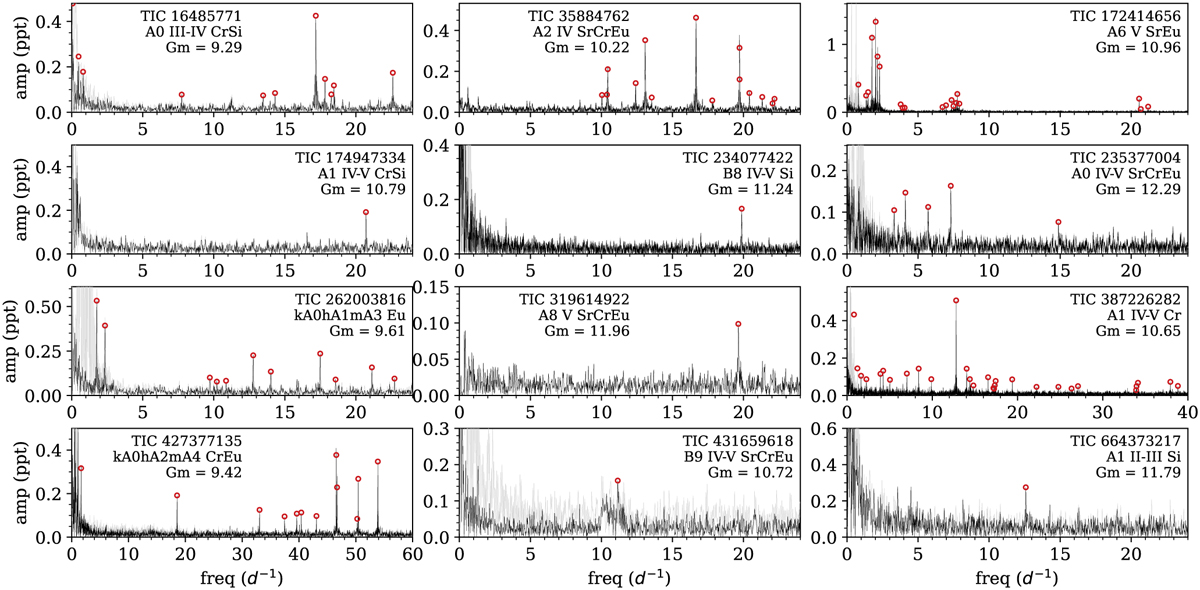
Fig. 7
Download original image
Frequency spectrum before (lighter grey) and after (black) detrending against the rotational modulation (and in some cases low-frequency systematics) for the 12 stars with higher-frequency signals (>10 day−1). The red circles mark frequencies detected in a manual PERIOD04 analysis. TIC identifiers, the spectral type from Paper I, and the Gaia magnitude are given in each panel.
Current usage metrics show cumulative count of Article Views (full-text article views including HTML views, PDF and ePub downloads, according to the available data) and Abstracts Views on Vision4Press platform.
Data correspond to usage on the plateform after 2015. The current usage metrics is available 48-96 hours after online publication and is updated daily on week days.
Initial download of the metrics may take a while.