Fig. 5
Download original image
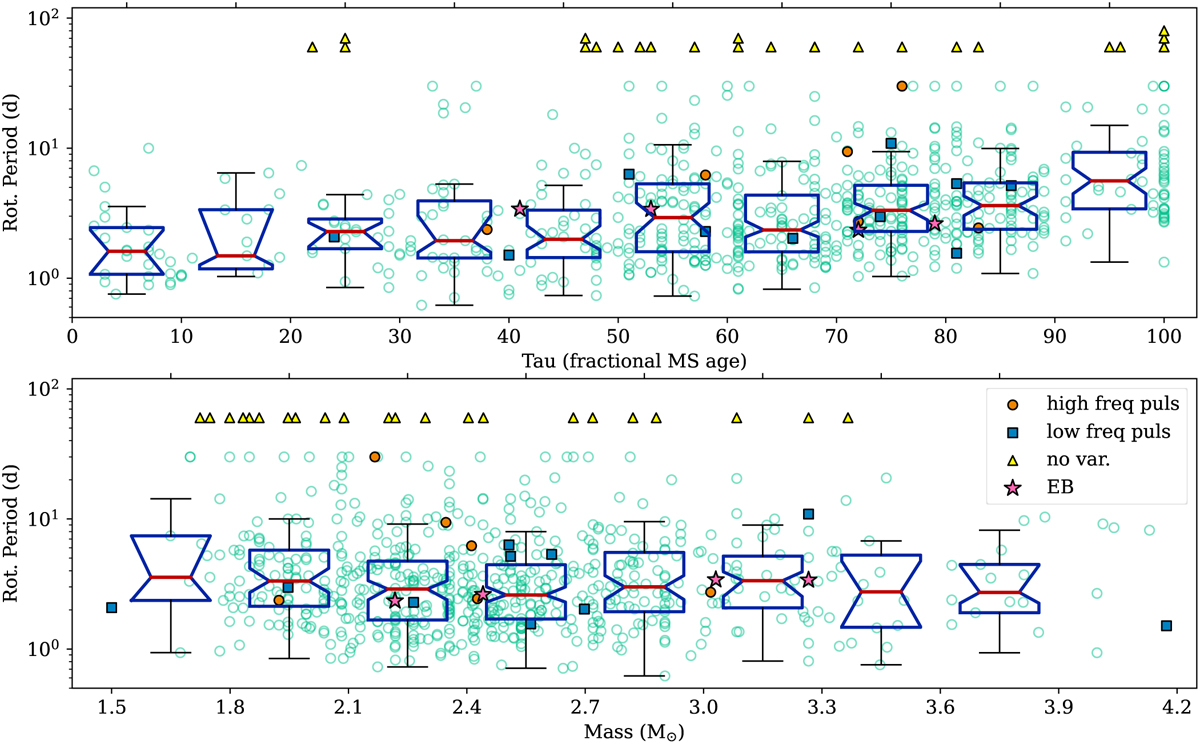
Derived rotation period from TESS versus the fractional main-sequence age (Tau, expressed as a percentage; upper panel) and stellar mass (lower panel). Data were binned, with the overlaid box plots extending from the lower to upper quartile values and the horizontal red line representing the median. The notches in the box indicate the 95% confidence interval of the median, and the whiskers extend to the limits of the binned data, excluding the statistical outliers. In the bottom panel, the first bin includes masses less than 1.8 M⊙, and the last bin all masses greater than 3.6 M⊙. Otherwise, the mass bins are 0.3 M⊙ wide. There is a correlation with more evolved stars having longer rotation periods, but there is apparently no correlation with the mass. Stars with additional high-frequency (> 10 day−1) or low-frequency (< 10 day−1) signals are indicated by the orange circles and blue squares, respectively (not all of them have stellar parameters from Paper I). Yellow triangles mark the 23 stars where no variability was detected (and we could not measure a rotation period), which are candidate very slow rotators. Stars with estimated rotation periods of “ >30:” (i.e. slow but detectable rotational variability longer than a single TESS sector, as in Fig. 3) are included in this plot with Prot = 30 days as a lower limit. The four EBs are marked by pink stars, but their mass and age may not be accurate since their binarity was not considered in Paper I.
Current usage metrics show cumulative count of Article Views (full-text article views including HTML views, PDF and ePub downloads, according to the available data) and Abstracts Views on Vision4Press platform.
Data correspond to usage on the plateform after 2015. The current usage metrics is available 48-96 hours after online publication and is updated daily on week days.
Initial download of the metrics may take a while.