Fig. 1
Download original image
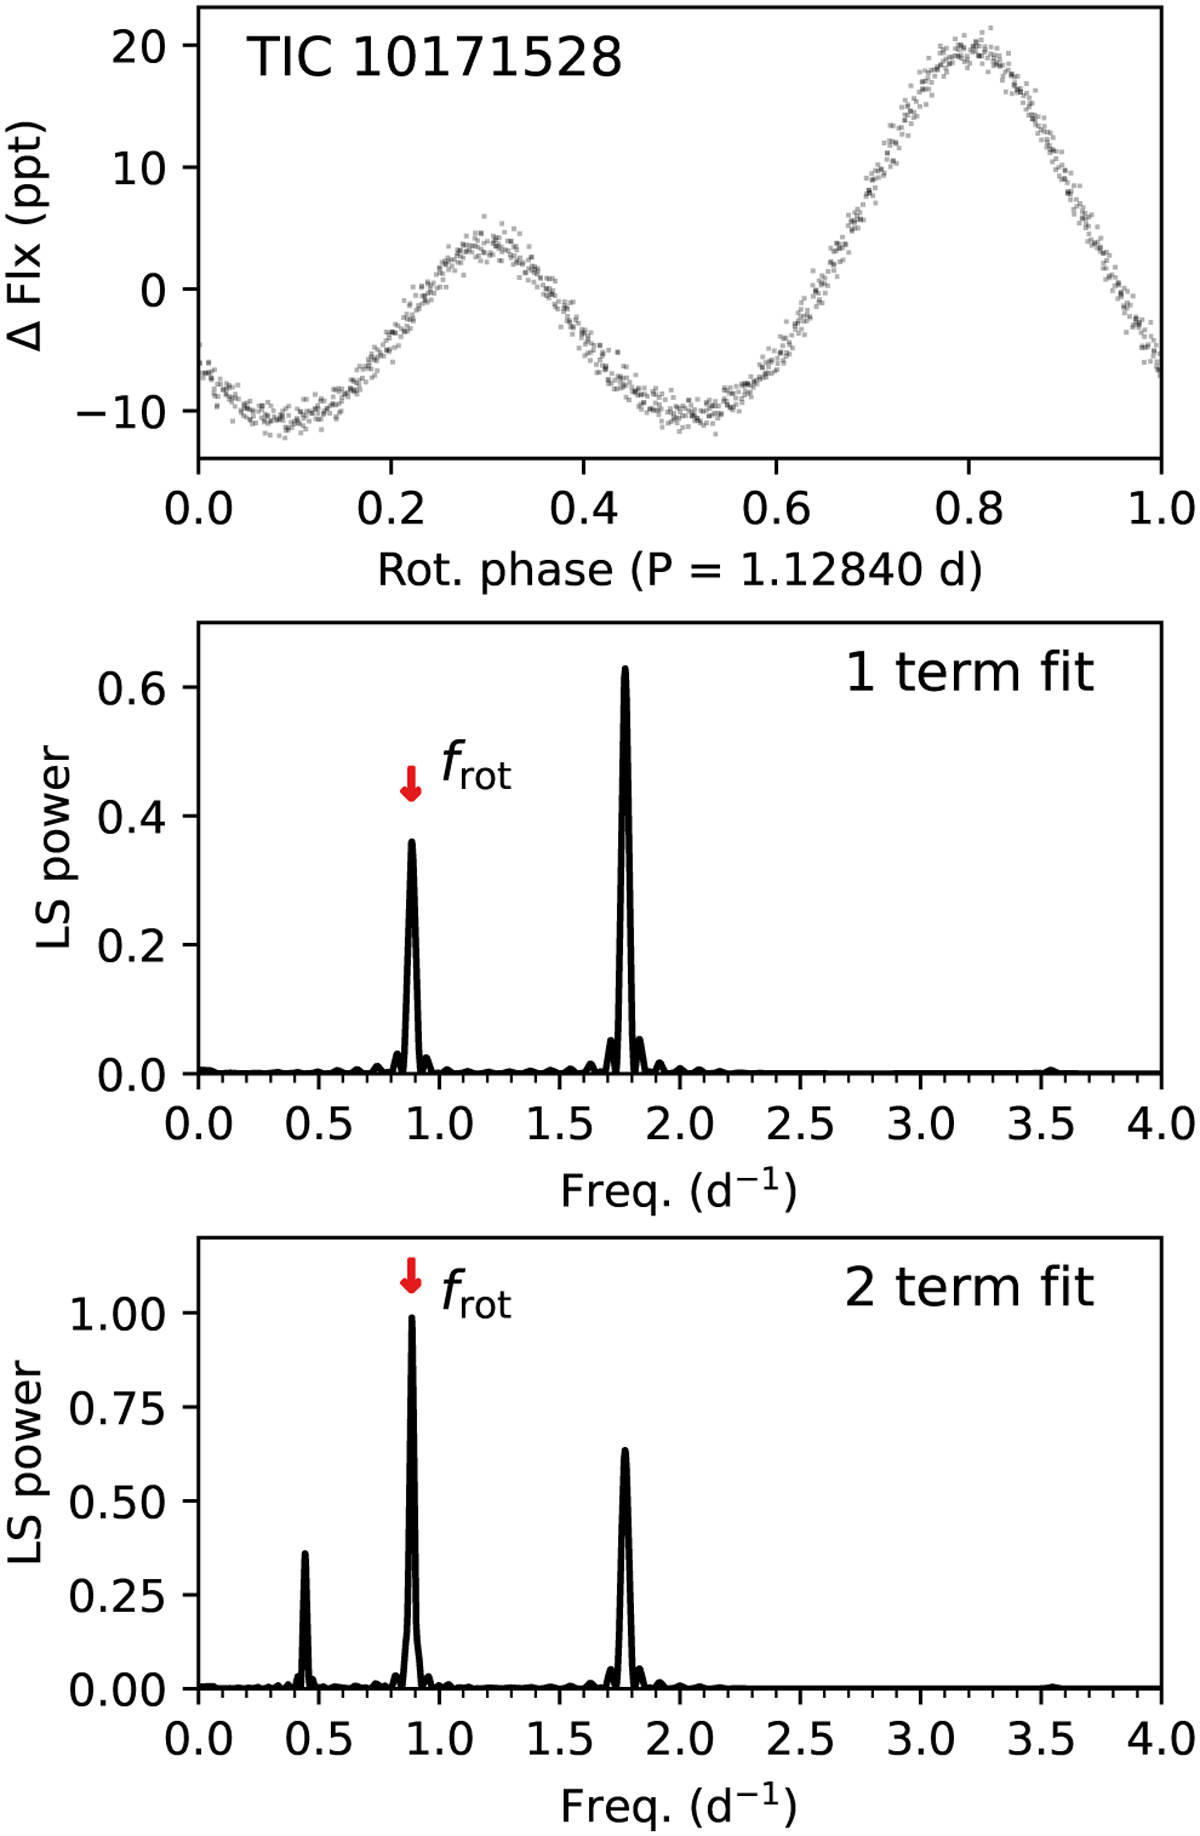
Comparison of one- and two-term Fourier analysis for identifying the rotation period. Top: phased TESS LC for an example mCP star with a decidedly double-waved pattern at the rotational period (i.e. two maxima and two minima per rotation). Middle: standard single-term frequency analysis, showing that the strongest peak is at 2×frot. Bottom: two-term frequency analysis, where the strongest peak is at frot.
Current usage metrics show cumulative count of Article Views (full-text article views including HTML views, PDF and ePub downloads, according to the available data) and Abstracts Views on Vision4Press platform.
Data correspond to usage on the plateform after 2015. The current usage metrics is available 48-96 hours after online publication and is updated daily on week days.
Initial download of the metrics may take a while.