Fig. 1
Download original image
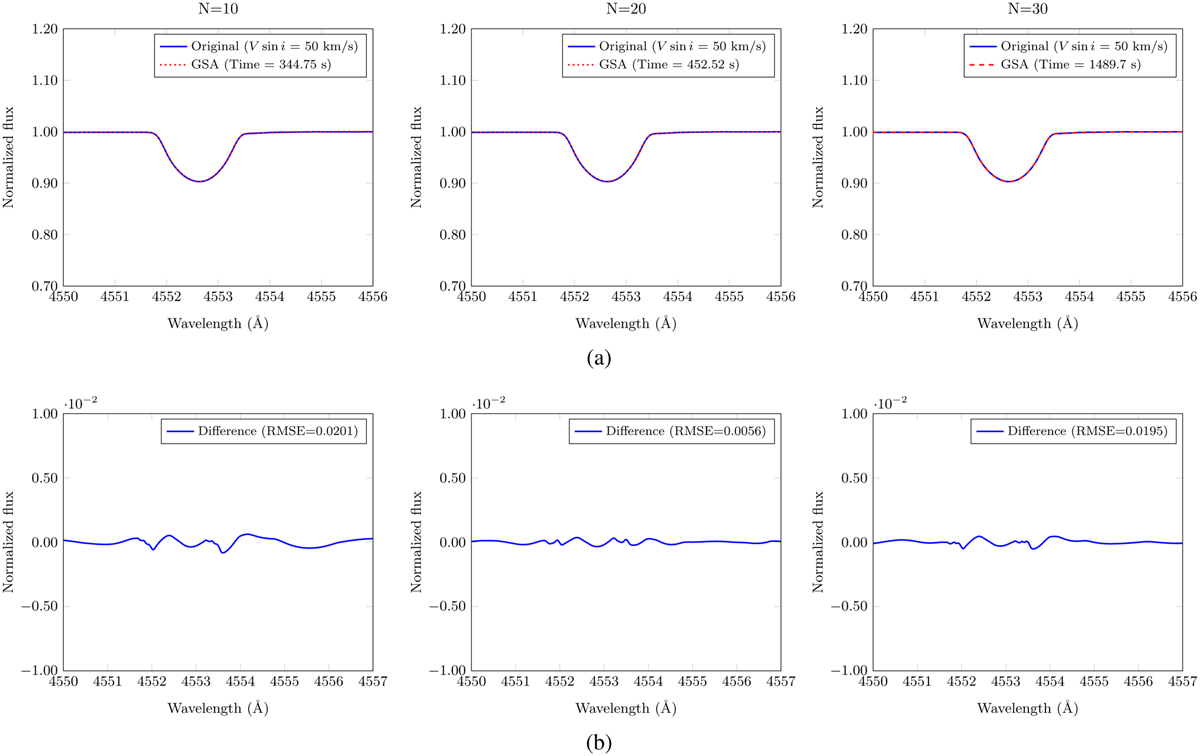
Absorption spectral line GSA for N = 10, 20, and 30 Gaussian functions. Top row (a): comparison of various GSA for an absorption line, employing different numbers of Gaussian functions in the approximation process. The blue solid line represents the synthetic profile, and the red dotted line represents the best GSA of 200 MC simulations. Bottom row (b): difference between the synthetic profiles and GSA. The blue solid line represents the difference between the synthetic profile and the best GSA.
Current usage metrics show cumulative count of Article Views (full-text article views including HTML views, PDF and ePub downloads, according to the available data) and Abstracts Views on Vision4Press platform.
Data correspond to usage on the plateform after 2015. The current usage metrics is available 48-96 hours after online publication and is updated daily on week days.
Initial download of the metrics may take a while.