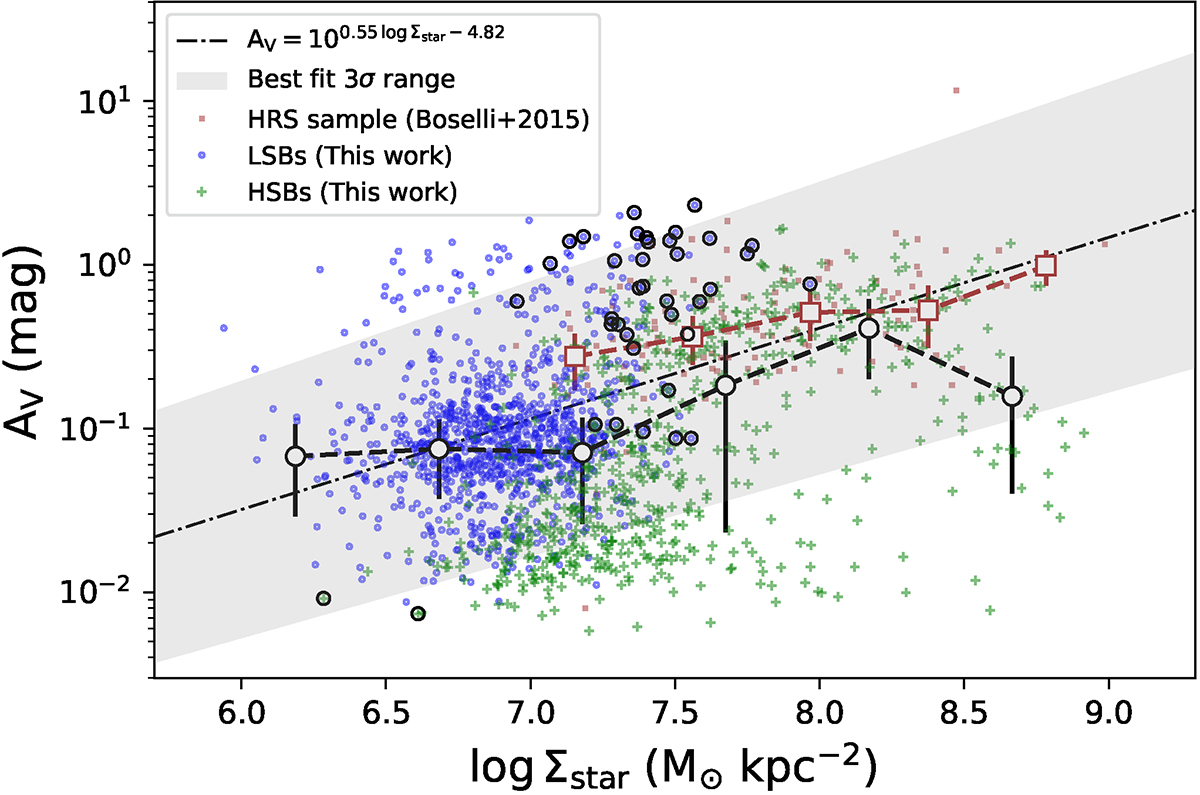
Fig. 9.
Download original image
V-band attenuation of the sample as a function of the stellar mass surface density. The black dot-dashed line is the best-fit line for our sample, and the gray shaded region is its corresponding 3σ uncertainty. The black open circles around some sources are the 3σ outliers of the ![]() –Σstar relation, as shown in Fig. 6 and discussed in Sect. 4.1. The AV values of our sample have a mean uncertainty of 0.12 mag.
–Σstar relation, as shown in Fig. 6 and discussed in Sect. 4.1. The AV values of our sample have a mean uncertainty of 0.12 mag.
Current usage metrics show cumulative count of Article Views (full-text article views including HTML views, PDF and ePub downloads, according to the available data) and Abstracts Views on Vision4Press platform.
Data correspond to usage on the plateform after 2015. The current usage metrics is available 48-96 hours after online publication and is updated daily on week days.
Initial download of the metrics may take a while.