Fig. 7.
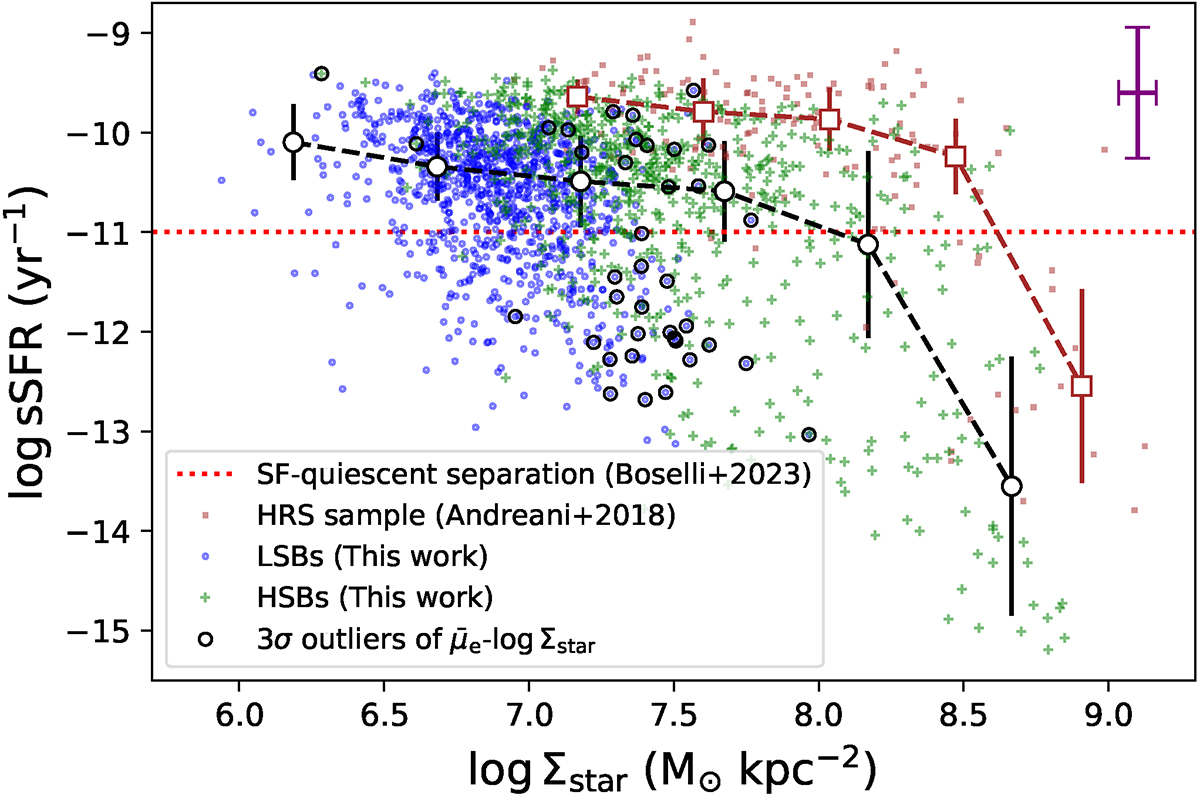
Download original image
Relationship between the specific star formation rate and stellar mass surface density. The symbols are the same as in Fig. 6. The red dashed line marks the separation of star-forming and quiescent galaxies (Boselli et al. 2023). The mean uncertainty of the sample obtained by propagating errors on individual measurements is given as the magenta error bar in the top-right corner.
Current usage metrics show cumulative count of Article Views (full-text article views including HTML views, PDF and ePub downloads, according to the available data) and Abstracts Views on Vision4Press platform.
Data correspond to usage on the plateform after 2015. The current usage metrics is available 48-96 hours after online publication and is updated daily on week days.
Initial download of the metrics may take a while.