Fig. 6.
Download original image
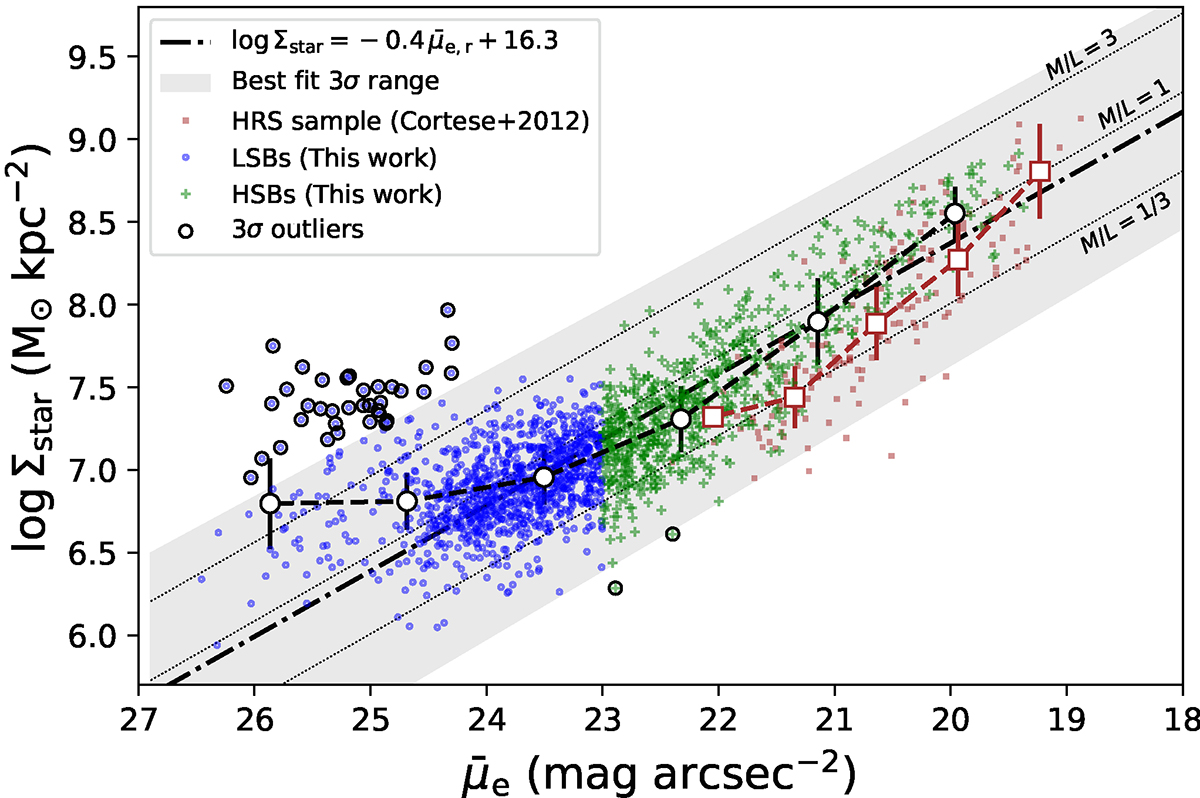
Stellar mass surface density (Σstar) as a function of the r-band average surface brightness within the effective radius (![]() ). The LSBs and HSBs are marked as blue open circles and green crosses, respectively. The black dashed line and the black circles mark the median distribution of our sample (the error bars are the median absolute deviation). The mean uncertainty of
). The LSBs and HSBs are marked as blue open circles and green crosses, respectively. The black dashed line and the black circles mark the median distribution of our sample (the error bars are the median absolute deviation). The mean uncertainty of ![]() and Σstar is 0.03 mag arcsec−2 and 0.07 M⊙ kpc−2, respectively. The brown squares are the HRS sample from Cortese et al. (2012a), and the brown dashed line and squares are their median distribution. The black dash-dotted line and the gray shaded region are the linear best-fit and 3σ scatter of our sample, respectively. The black open circles around some sources are the 3σ outliers of the best-fit line. The three black dotted lines correspond to the expected relation between Σstar and
and Σstar is 0.03 mag arcsec−2 and 0.07 M⊙ kpc−2, respectively. The brown squares are the HRS sample from Cortese et al. (2012a), and the brown dashed line and squares are their median distribution. The black dash-dotted line and the gray shaded region are the linear best-fit and 3σ scatter of our sample, respectively. The black open circles around some sources are the 3σ outliers of the best-fit line. The three black dotted lines correspond to the expected relation between Σstar and ![]() based on fixed fiducial mass-to-light ratios of 1/3, 1, and 3 M⊙/L⊙ (Chamba et al. 2022), as discussed in Sect. 4.
based on fixed fiducial mass-to-light ratios of 1/3, 1, and 3 M⊙/L⊙ (Chamba et al. 2022), as discussed in Sect. 4.
Current usage metrics show cumulative count of Article Views (full-text article views including HTML views, PDF and ePub downloads, according to the available data) and Abstracts Views on Vision4Press platform.
Data correspond to usage on the plateform after 2015. The current usage metrics is available 48-96 hours after online publication and is updated daily on week days.
Initial download of the metrics may take a while.