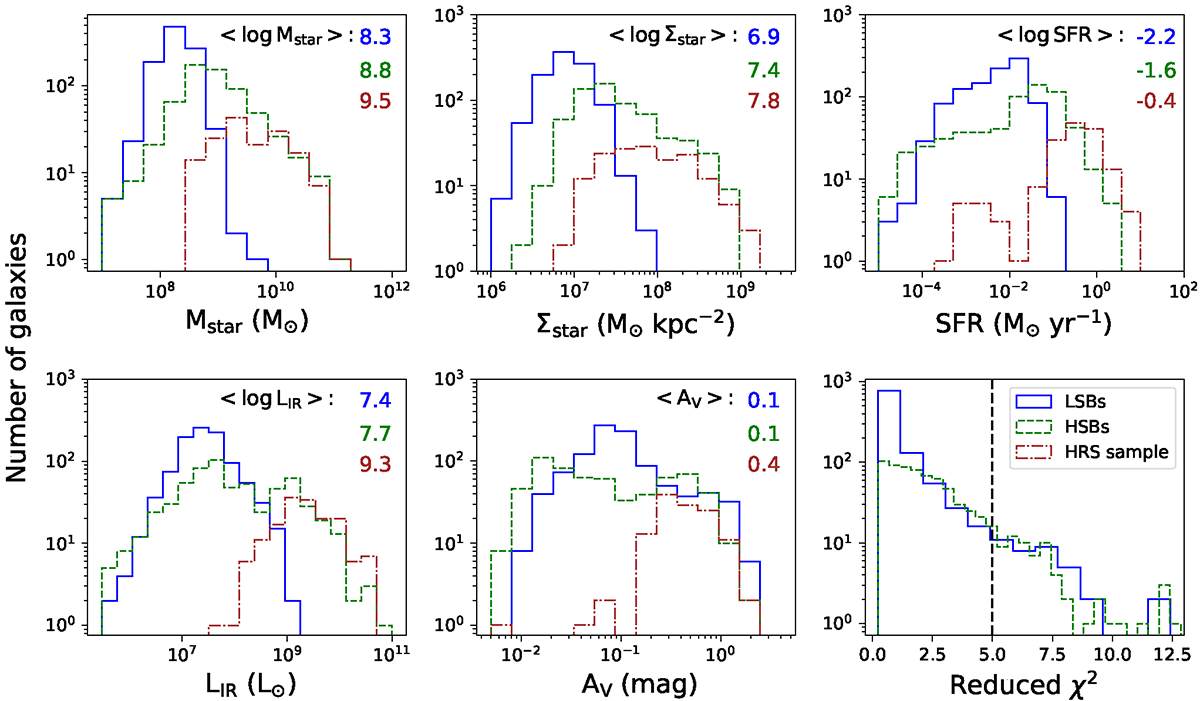
Fig. 5.
Download original image
Distribution of the best-fit parameters of our NEP sample obtained from the SED fitting. The LSBs and HSBs are marked as the blue solid and the green dashed histograms, respectively. The HRS comparison sample used in this work is shown as the brown dash-dotted distribution. The median values corresponding to each parameter are marked inside the panels in blue, green, and brown colors for the LSBs, HSBs, and the HRS sample, respectively. The bottom-right panel gives the reduced χ2 obtained from the SED fitting, and the black vertical dashed line in the panel marks the arbitrary selection cut we used to remove bad fits.
Current usage metrics show cumulative count of Article Views (full-text article views including HTML views, PDF and ePub downloads, according to the available data) and Abstracts Views on Vision4Press platform.
Data correspond to usage on the plateform after 2015. The current usage metrics is available 48-96 hours after online publication and is updated daily on week days.
Initial download of the metrics may take a while.