Fig. A.2.
Download original image
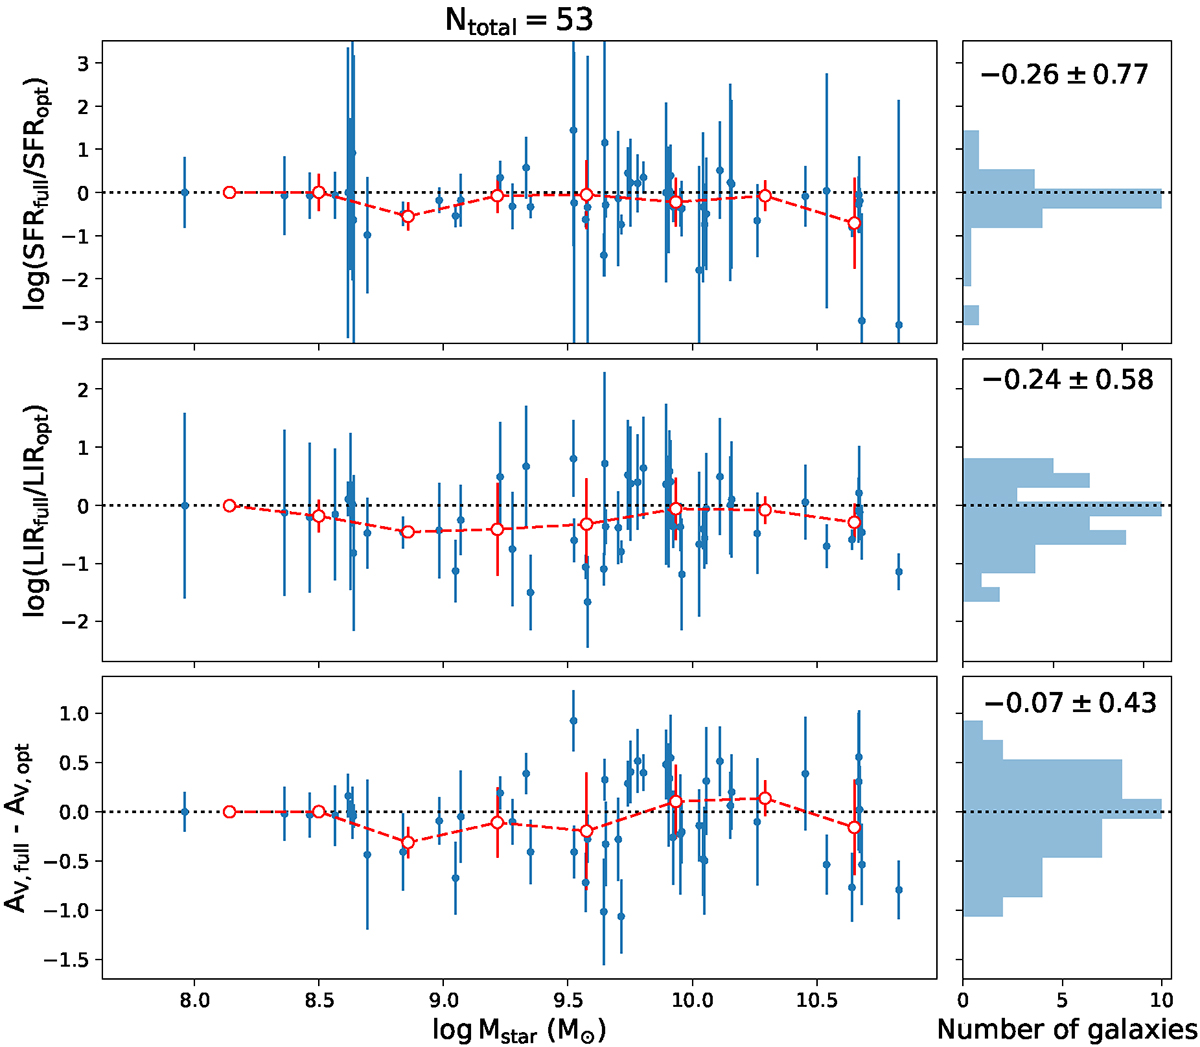
Comparison of the SED fitting results for the 53 FIR-detected galaxies using their full photometry from UV to FIR with respect to a fitting using only the optical ugrizy-bands. From top to bottom, the panels show the difference in SFR, LIR, and AV estimated from the two fits, as a function of the stellar mass of the galaxies. The red dashed line marks the mean and scatter along different stellar mass bins. The histograms beside each panel give the overall distribution of each quantity, with their mean and scatter indicated at the top of each histogram. When comparing the stellar mass estimates of the two fits, we found that there is only a minor difference, as expected, with a mean difference of −0.09 ± 0.13 dex.
Current usage metrics show cumulative count of Article Views (full-text article views including HTML views, PDF and ePub downloads, according to the available data) and Abstracts Views on Vision4Press platform.
Data correspond to usage on the plateform after 2015. The current usage metrics is available 48-96 hours after online publication and is updated daily on week days.
Initial download of the metrics may take a while.