Fig. A.1.
Download original image
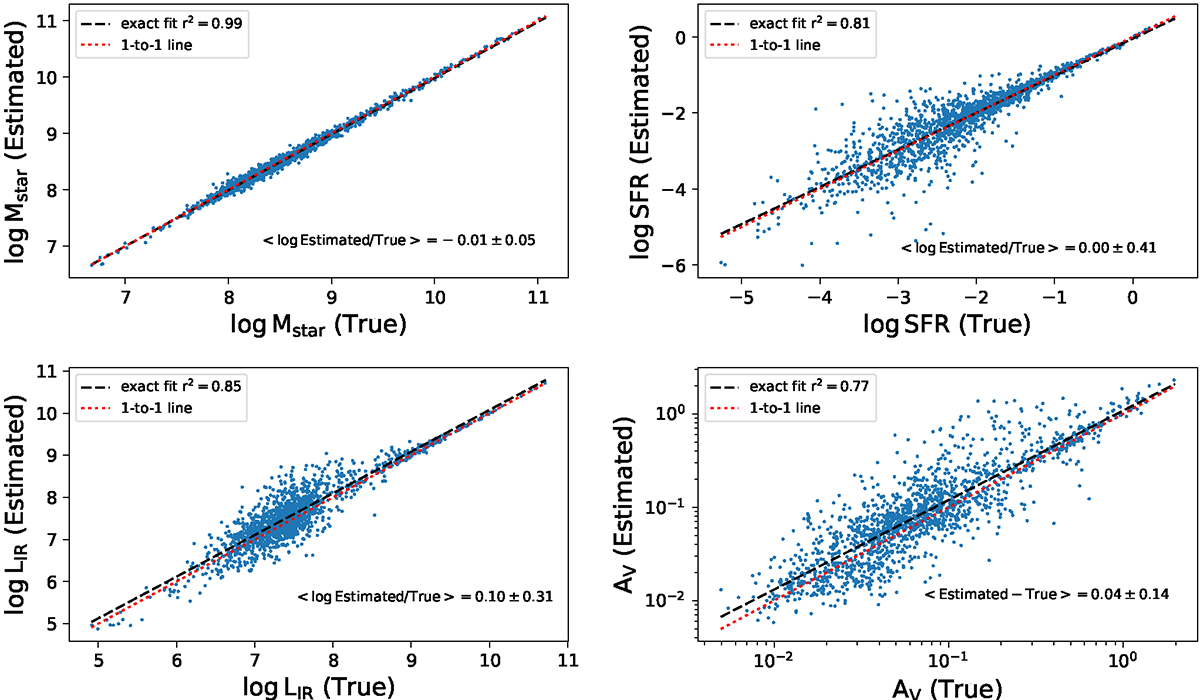
Mock analysis performed using CIGALE to compare the “true” values from the mock catalog with the Bayesian estimated values. The black dashed lines show the linear regression fit, and the corresponding regression coefficients (r2) are marked in each panel. The red dotted line is the one-to-one relation. The mean difference and scatter between the estimated and true values are marked in each panel.
Current usage metrics show cumulative count of Article Views (full-text article views including HTML views, PDF and ePub downloads, according to the available data) and Abstracts Views on Vision4Press platform.
Data correspond to usage on the plateform after 2015. The current usage metrics is available 48-96 hours after online publication and is updated daily on week days.
Initial download of the metrics may take a while.