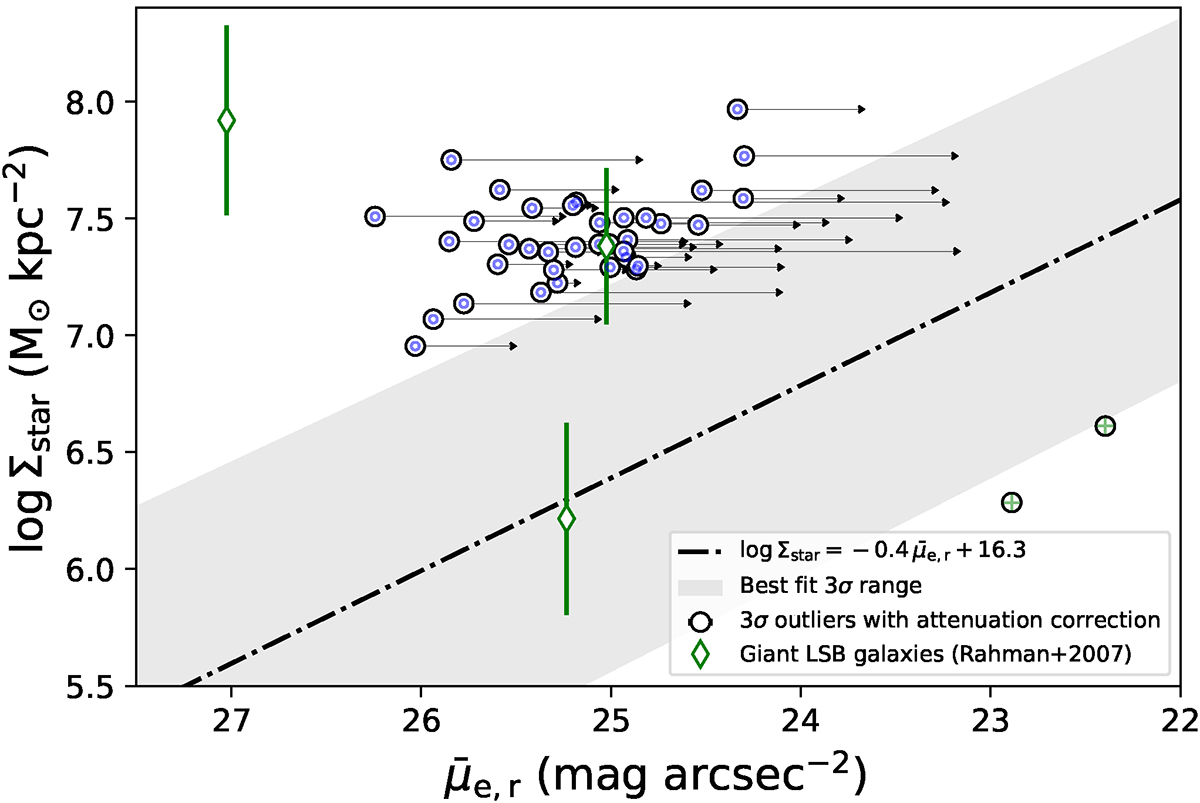
Fig. 10.
Download original image
3σ outliers of the surface brightness-stellar mass surface density linear relation discussed in Sect. 4.1. The black arrows indicate the directions/positional changes on this plane, and how the outliers (open circles) will move after the correction for the r-band attenuation. The green diamond symbols mark the location of three giant LSB galaxies (Malin 1, UGC 9024, and UGC 6614, from the left to right, respectively) from the literature (Rahman et al. 2007). The black dash-dotted and the gray shaded region is the best-fit line and its 3σ confidence range as described in Sect. 4.1.
Current usage metrics show cumulative count of Article Views (full-text article views including HTML views, PDF and ePub downloads, according to the available data) and Abstracts Views on Vision4Press platform.
Data correspond to usage on the plateform after 2015. The current usage metrics is available 48-96 hours after online publication and is updated daily on week days.
Initial download of the metrics may take a while.