Open Access
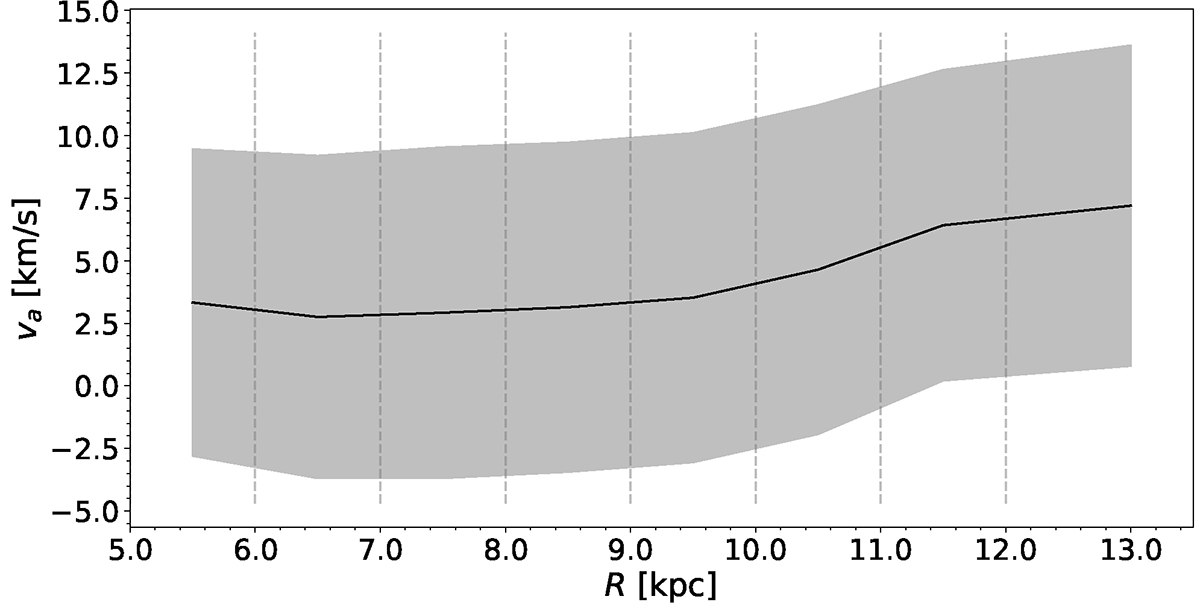
Fig. 7.
Download original image
Asymmetric drift profile. The black line shows the asymmetric drift correction in each radial bin and the shaded region depicts its propagated uncertainty. We note that the uncertainties are fully correlated between the bins.
Current usage metrics show cumulative count of Article Views (full-text article views including HTML views, PDF and ePub downloads, according to the available data) and Abstracts Views on Vision4Press platform.
Data correspond to usage on the plateform after 2015. The current usage metrics is available 48-96 hours after online publication and is updated daily on week days.
Initial download of the metrics may take a while.