Fig. 6.
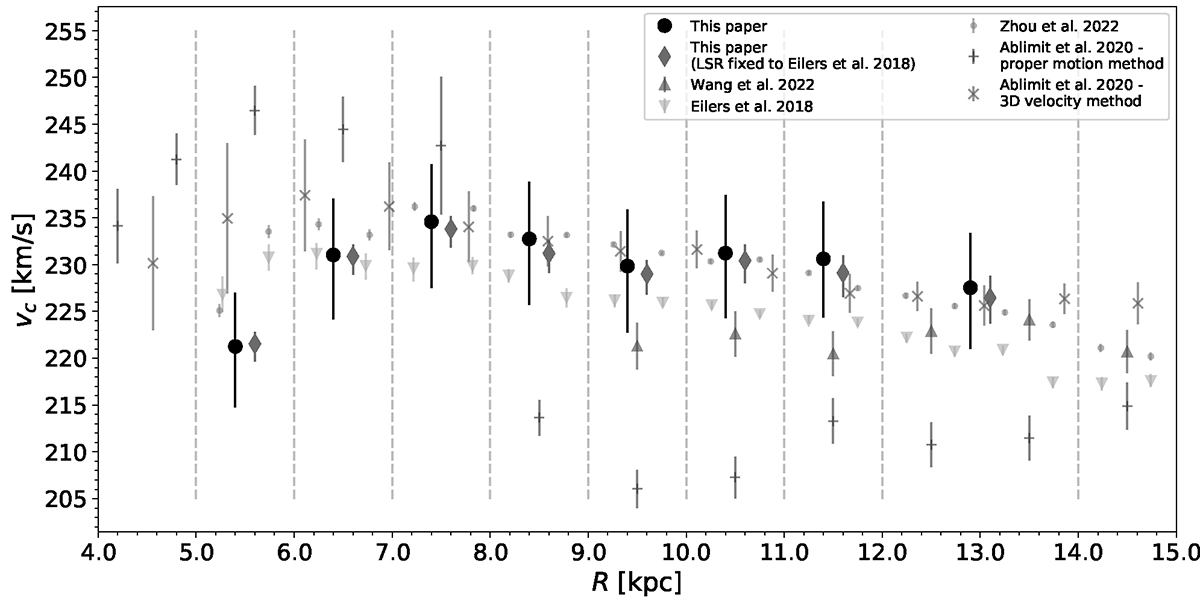
Download original image
Circular velocity curve obtained from the MCMC. Grey dashed lines have been plotted to indicate the position of each radial bin. In black (with circles) we show the circular velocities as obtained in this paper where the error bars correspond to the 16th and 84th percentile of the circular velocity posterior distribution in a particular bin. We adopted R0 = 8.277 kpc to convert the adimensional coordinate x into Galactocentric distance R.
Current usage metrics show cumulative count of Article Views (full-text article views including HTML views, PDF and ePub downloads, according to the available data) and Abstracts Views on Vision4Press platform.
Data correspond to usage on the plateform after 2015. The current usage metrics is available 48-96 hours after online publication and is updated daily on week days.
Initial download of the metrics may take a while.