Fig. 9
Download original image
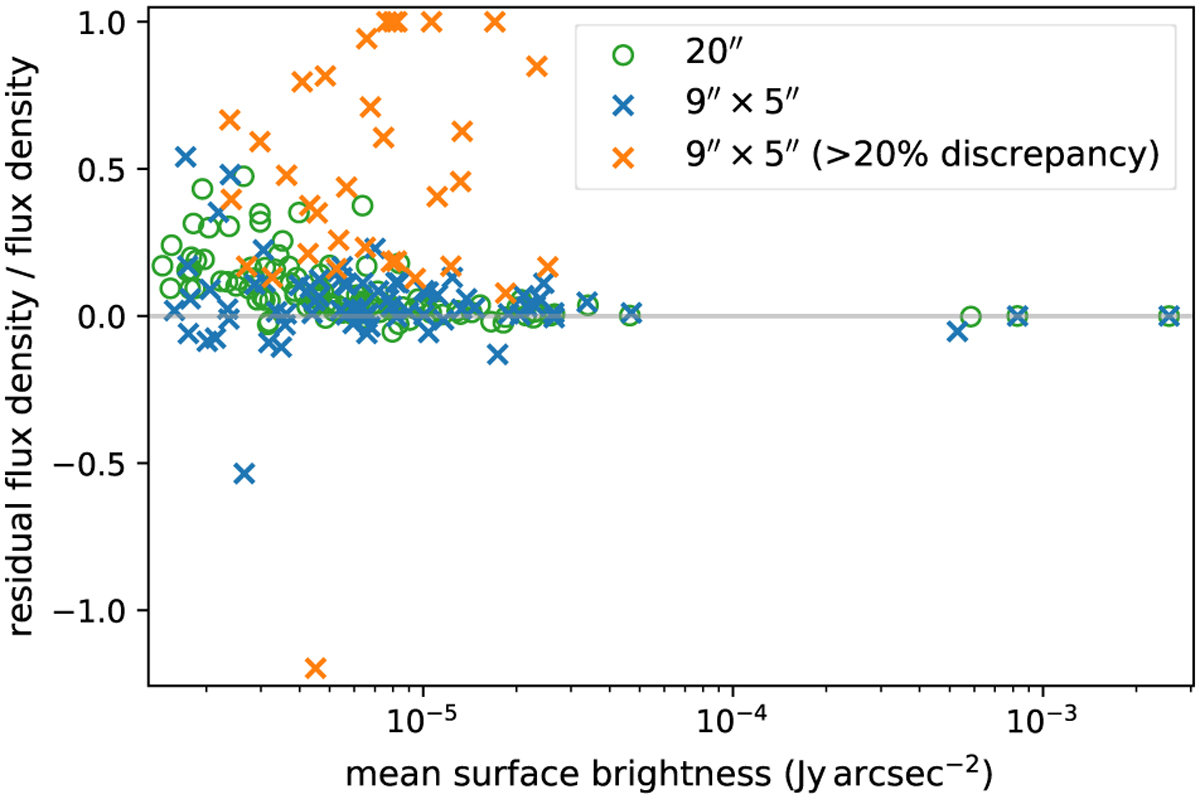
Ratio between the flux density measured from the residual and the restored images (y-axis) as a function of mean surface brightness (x-axis). Circles and crosses mark measurements from the low-resolution and high-resolution mosaic, respectively. For the orange crosses, the difference between the flux density in the low- and high-resolution measurements is above 20%.
Current usage metrics show cumulative count of Article Views (full-text article views including HTML views, PDF and ePub downloads, according to the available data) and Abstracts Views on Vision4Press platform.
Data correspond to usage on the plateform after 2015. The current usage metrics is available 48-96 hours after online publication and is updated daily on week days.
Initial download of the metrics may take a while.