Fig. A.1
Download original image
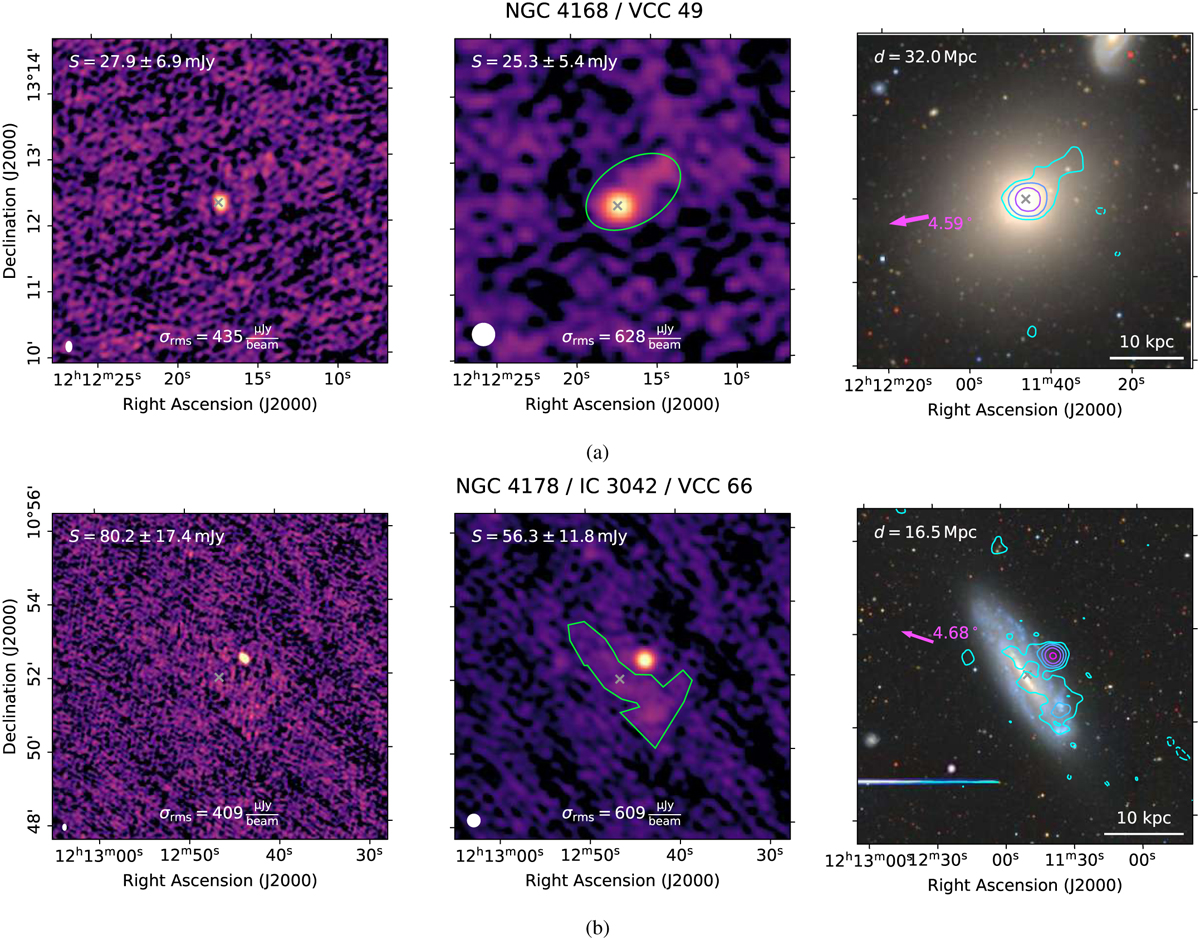
LOFAR images of the galaxy VCC 144 at resolutions of 9″ × 5″ (left panel) and 20″ (center panel), and the corresponding optical image of the DESI Legacy Imaging Survey DR9 (Dey et al. 2019) with the 20″ LOFAR contours starting from 3σ and increasing in powers of two (right panel). The region outlined in green in the central panel marks the area used for the flux density measurement at high- and low-resolution. The measured flux density is displayed in the top left corner and the background RMS σrms of the maps at the bottom. In the right panel, the pink arrow marks the direction of and distance to the cluster center (M 87), and the redshift-independent distance d is reported in the top left.
Current usage metrics show cumulative count of Article Views (full-text article views including HTML views, PDF and ePub downloads, according to the available data) and Abstracts Views on Vision4Press platform.
Data correspond to usage on the plateform after 2015. The current usage metrics is available 48-96 hours after online publication and is updated daily on week days.
Initial download of the metrics may take a while.