Open Access
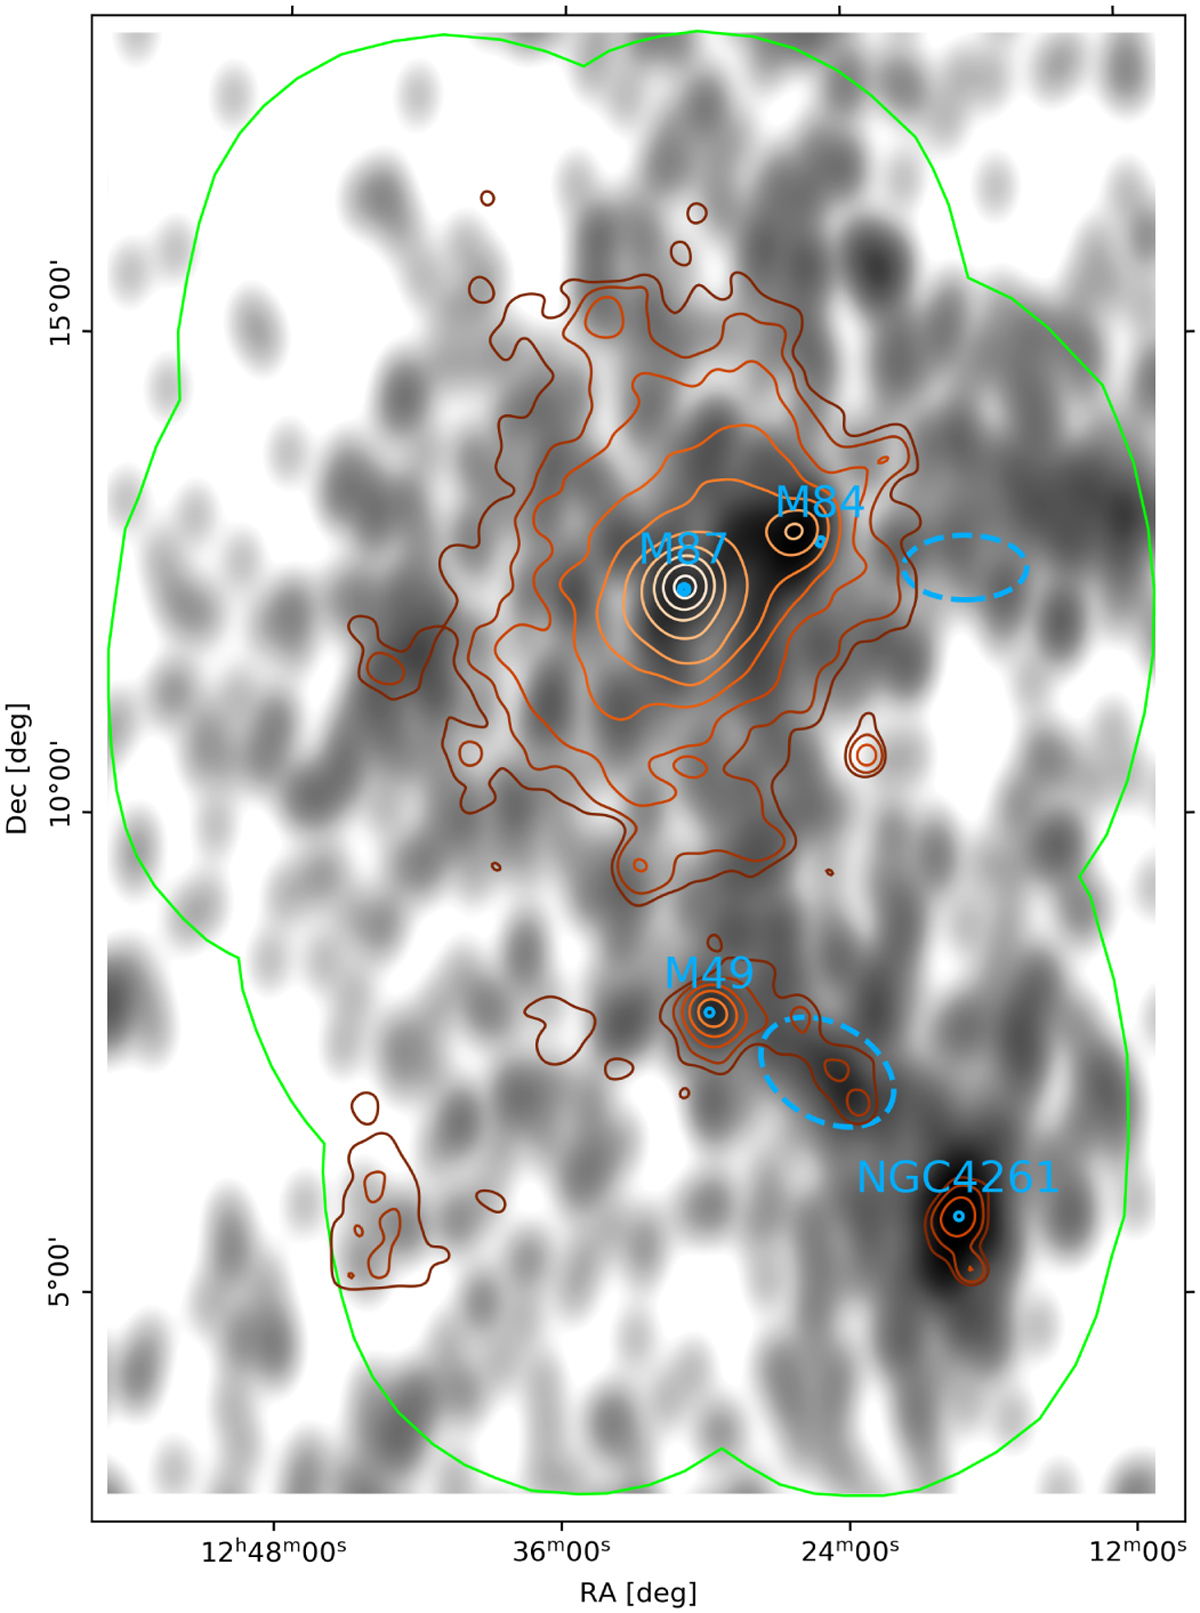
Fig. 12
Download original image
Projected galaxy density of the EVCC. Orange contours show the eROSITA source-subtracted X-ray surface brightness (McCall et al., in prep.), the green contour outlines the footprint of the LOFAR observations, and the blue circles and dotted ellipses mark individual galaxies and the extended emission as in Fig. 11.
Current usage metrics show cumulative count of Article Views (full-text article views including HTML views, PDF and ePub downloads, according to the available data) and Abstracts Views on Vision4Press platform.
Data correspond to usage on the plateform after 2015. The current usage metrics is available 48-96 hours after online publication and is updated daily on week days.
Initial download of the metrics may take a while.