Fig. 1
Download original image
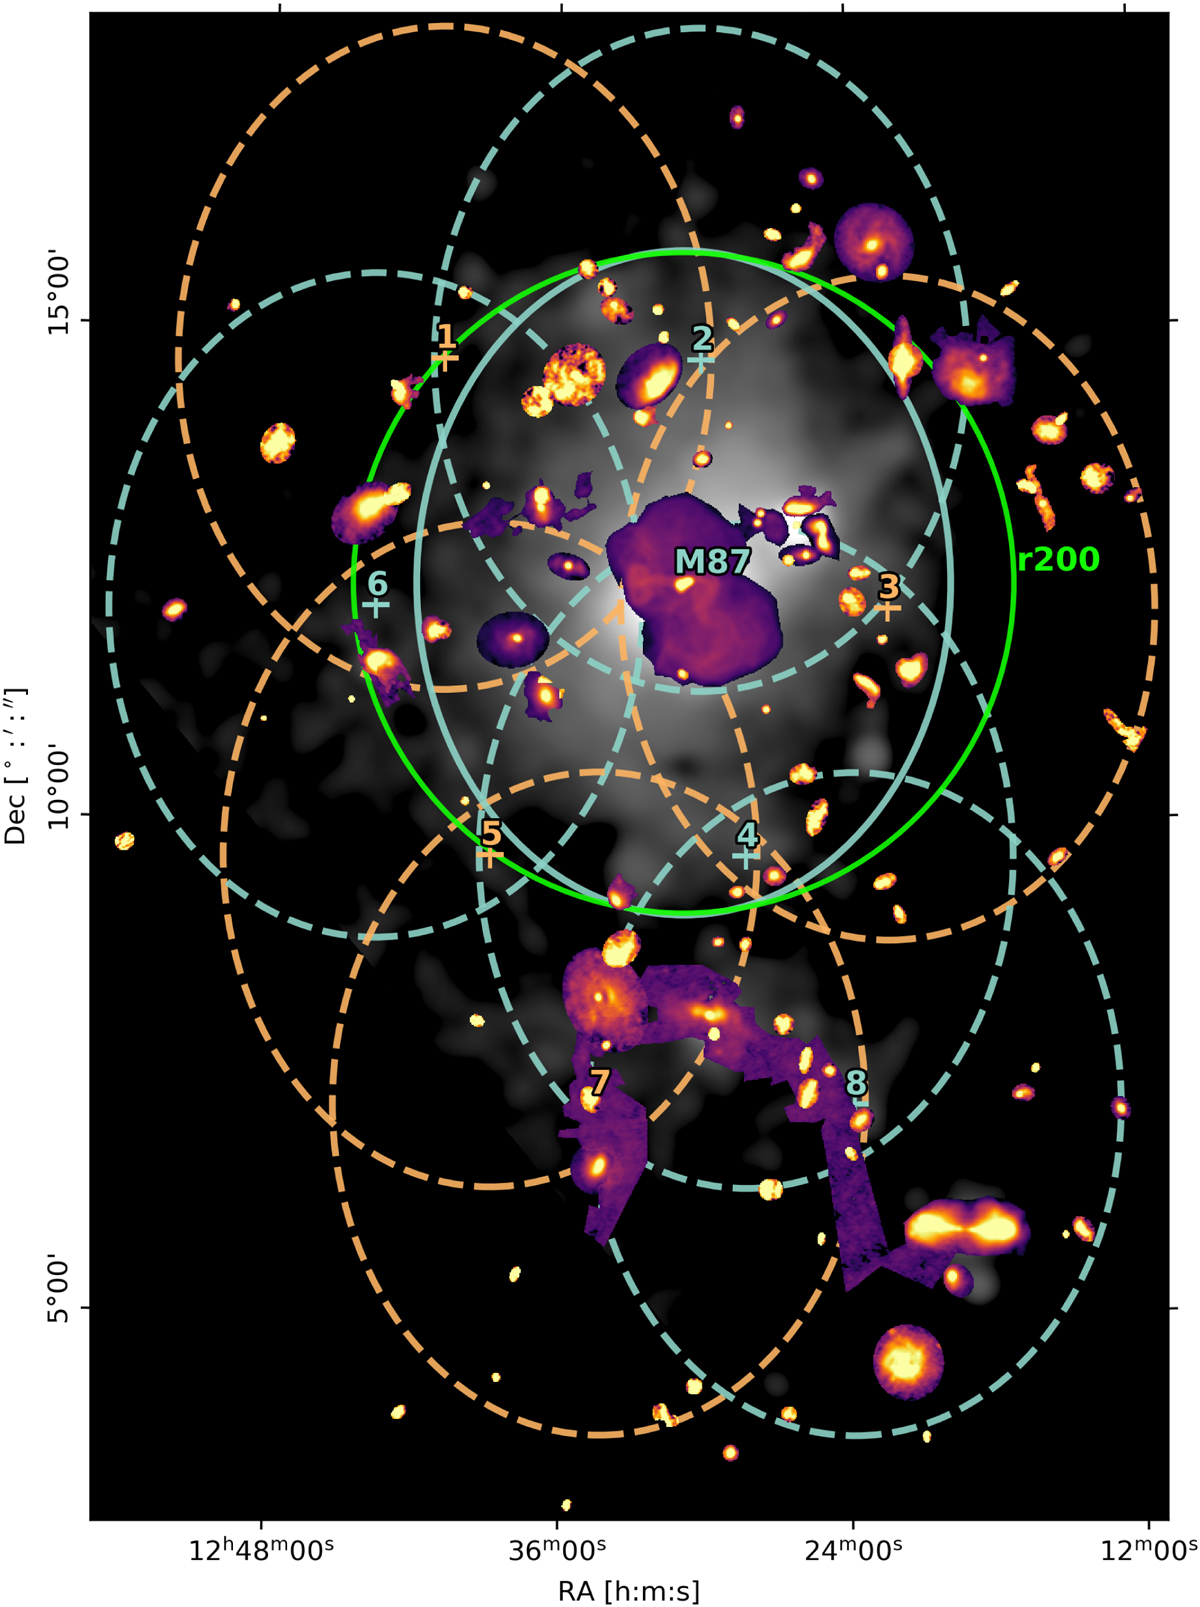
Overview of the LOFAR HBA Virgo cluster survey. As cutouts, we show the radio-detected galaxies from the 20″ mosaic; for better visualization, their sizes are magnified by a factor of six and their color mappings adjusted individually. The central points and the half-maximum primary beam ellipses of the nine survey pointings are displayed in alternating colors (orange/blue). The green circle marks r200 and the grayscale background image is the eROSITA X-ray map in the 0.3–2 keV band (McCall et al., in prep.) where we mask the southeastern emission in the direction of the NPS.
Current usage metrics show cumulative count of Article Views (full-text article views including HTML views, PDF and ePub downloads, according to the available data) and Abstracts Views on Vision4Press platform.
Data correspond to usage on the plateform after 2015. The current usage metrics is available 48-96 hours after online publication and is updated daily on week days.
Initial download of the metrics may take a while.