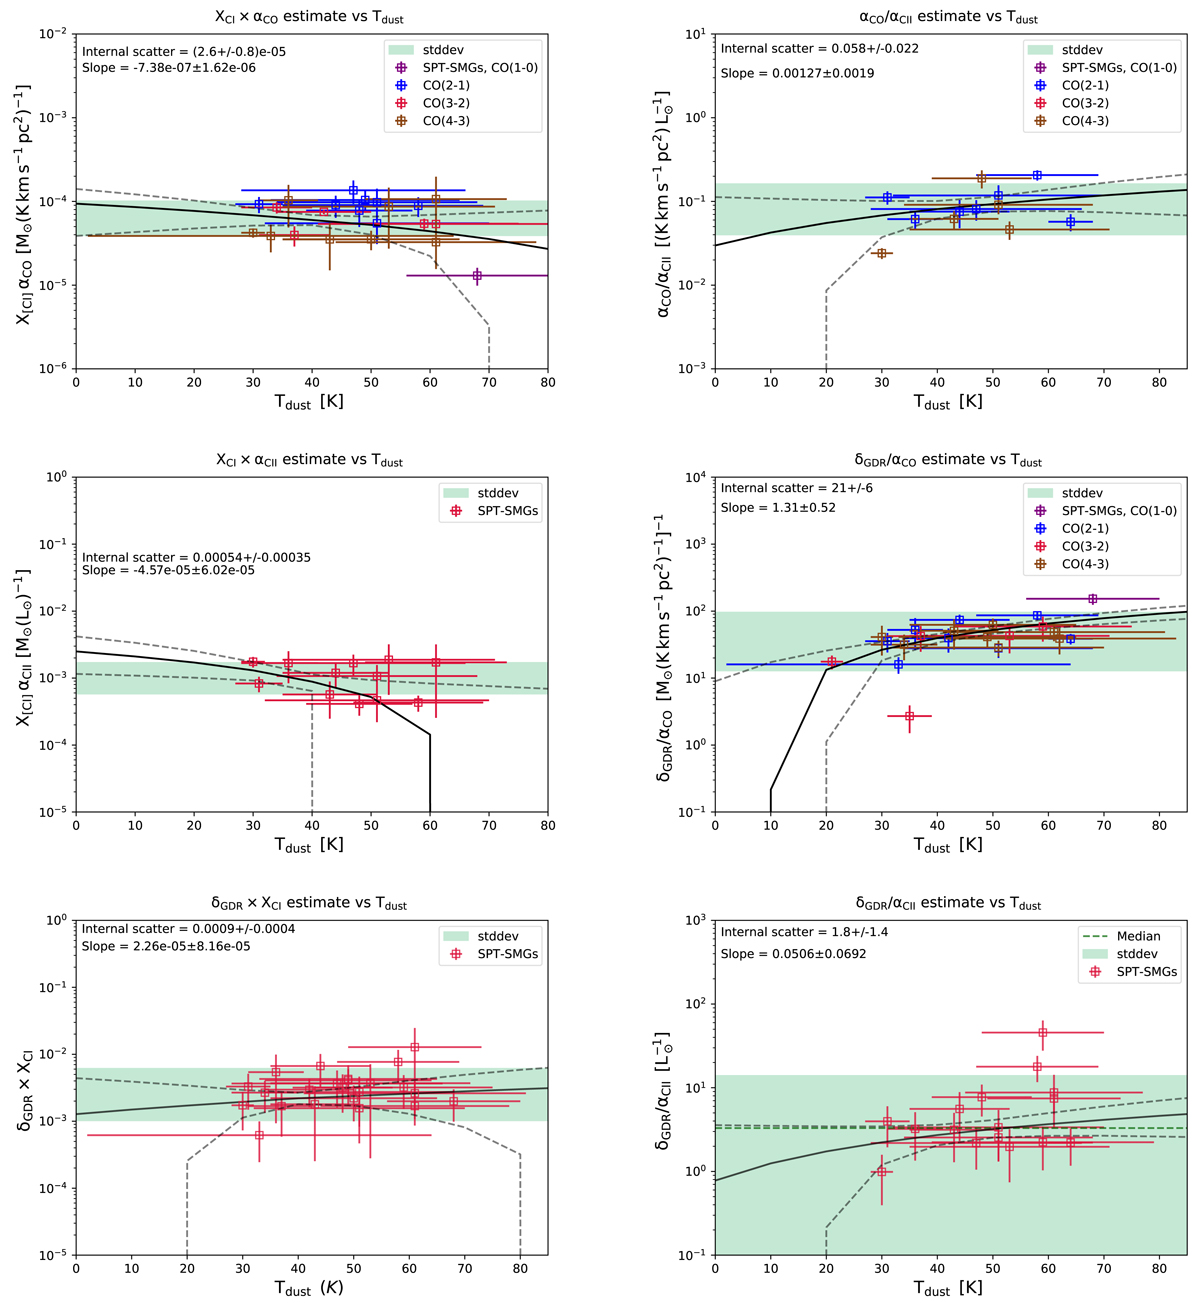
Fig. A.1.
Download original image
XCI × αCO, XCI × α[CII], and XCI × δGDR (left column) and αCO/α[CII], δGDR/ αCO, and δGDR/ α[CII] (right column) as a function of Tdust for our sample. Our sample is represented in squares, colour-coded by the CO transition used to estimate the CO-based gas mass: CO(1-0) transition in purple, CO(2-1) in blue, CO(3-2) in red, and CO(4-3) in brown (top and centre rows). The green shaded region represents the 1 σ region around the sample mean. We also plot the linear regression best fit and the 1 σ region from Linmix as the black solid and black-dashed line, respectively.
Current usage metrics show cumulative count of Article Views (full-text article views including HTML views, PDF and ePub downloads, according to the available data) and Abstracts Views on Vision4Press platform.
Data correspond to usage on the plateform after 2015. The current usage metrics is available 48-96 hours after online publication and is updated daily on week days.
Initial download of the metrics may take a while.