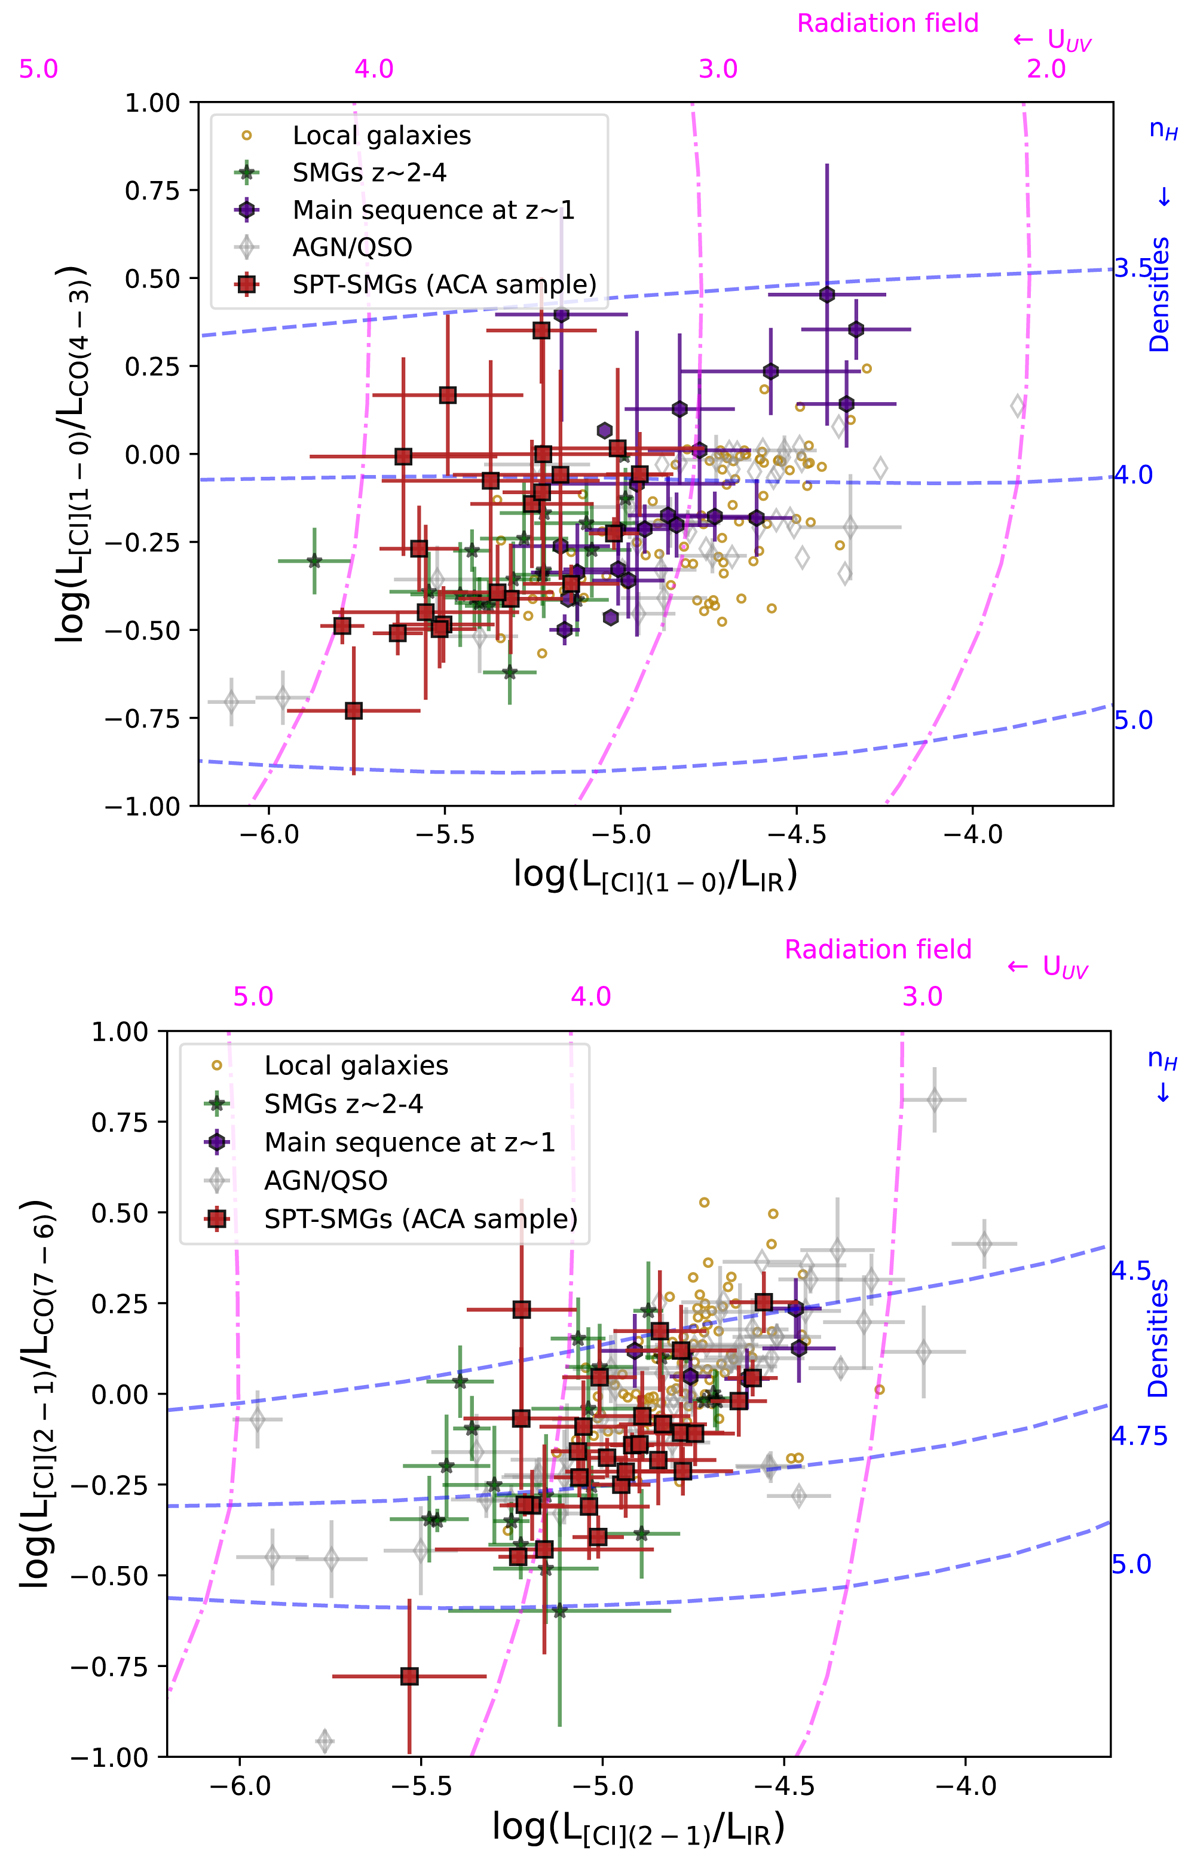
Fig. 5.
Download original image
L[CI](1 − 0)/LCO(4 − 3) vs. L[CI](1 − 0)/LIR in the top panel and L[CI](2 − 1)/LCO(7 − 6) vs. L[CI](2 − 1)/LIR in the bottom panel for our sample. Our sources are represented as red squares. The SMGs (dark green stars), main-sequence galaxies at z ∼ 1 (indigo hexagons), local galaxies (gold empty circles), and AGNs (grey diamonds) from the Valentino et al. (2020) compilation are plotted along with our sample. The isocontours of density and radiation field intensity are plotted as grey dashed and grey dot-dashed lines, respectively. These isocontours are obtained from the PDR modelling of Kaufman et al. (2006) from the PDR toolbox (Pound & Wolfire 2023). The individual luminosities are not corrected for magnification.
Current usage metrics show cumulative count of Article Views (full-text article views including HTML views, PDF and ePub downloads, according to the available data) and Abstracts Views on Vision4Press platform.
Data correspond to usage on the plateform after 2015. The current usage metrics is available 48-96 hours after online publication and is updated daily on week days.
Initial download of the metrics may take a while.