Fig. 4.
Download original image
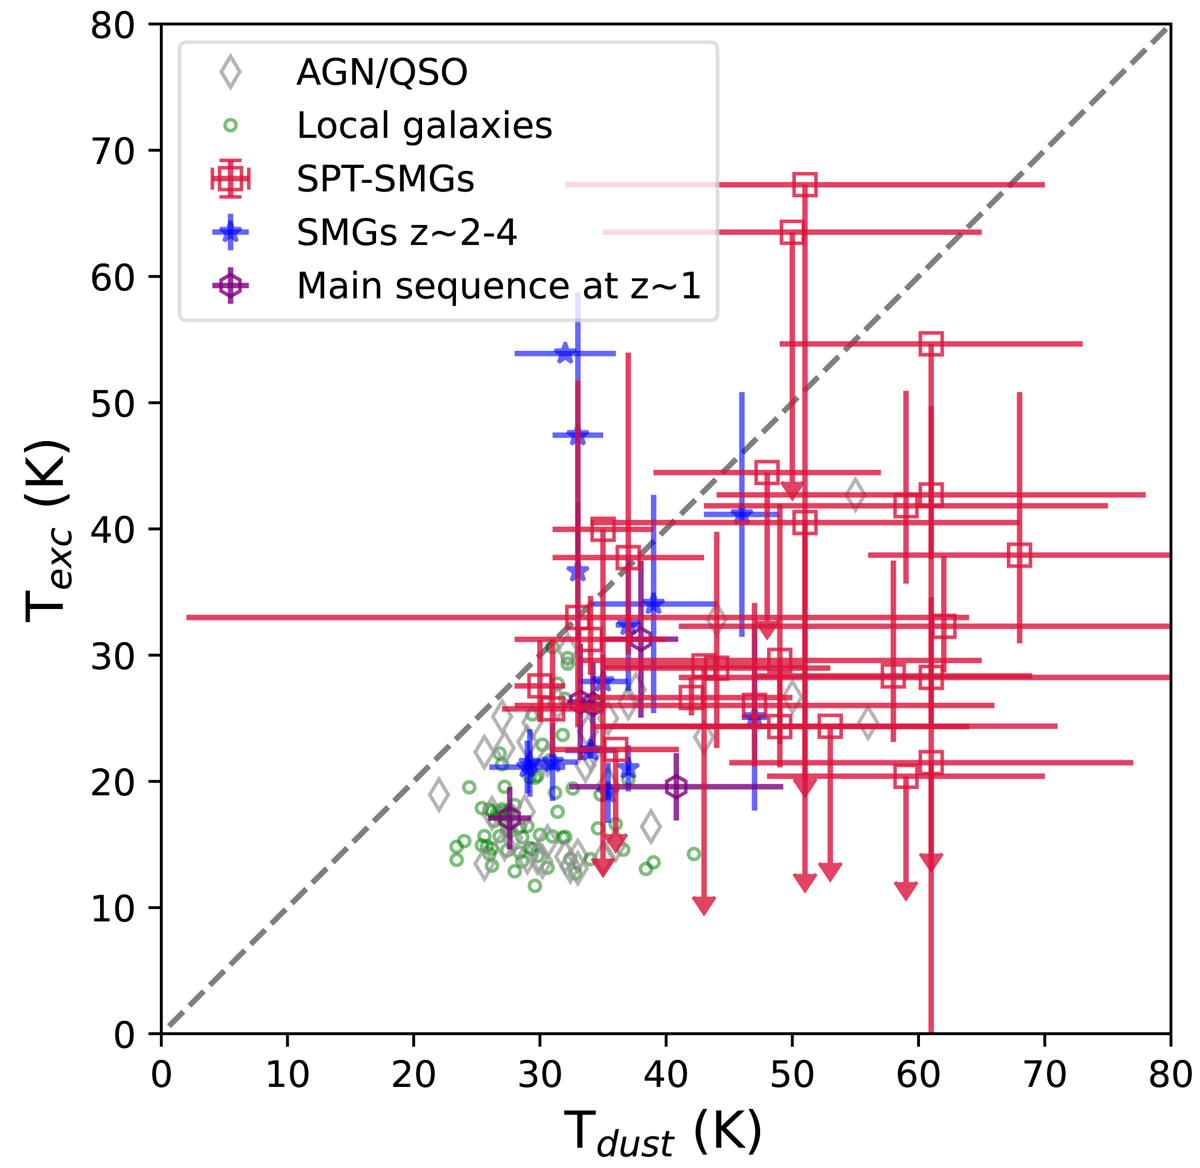
[CI] excitation vs. dust temperature for our sample. Our sources are represented as red-squares. Sources with 1σ to 3σ detections in either or both [CI] lines are represented as upper-limits. The dust temperatures for our sample are from the SED fits of Reuter et al. (2020). Also compared are the excitation temperatures of SMGs (blue stars), main-sequence galaxies at z ∼ 1 (purple hexagons), local galaxies (green points), and AGNs (grey diamonds) from the Valentino et al. (2020) compilation. The grey dashed line corresponds to the 1:1 relation between the dust and [CI] excitation temperatures.
Current usage metrics show cumulative count of Article Views (full-text article views including HTML views, PDF and ePub downloads, according to the available data) and Abstracts Views on Vision4Press platform.
Data correspond to usage on the plateform after 2015. The current usage metrics is available 48-96 hours after online publication and is updated daily on week days.
Initial download of the metrics may take a while.